IB MYP 4-5 Biology Chapter 12 : Models–Practice Questions

Question:

What is the value in starting a scientific investigation by framing a hypothesis?

▶️Answer/Explanation

Ans: Helps in the design of the experiment; the control and experimental variables can be defined based on the hypothesis; the experimental method is determined by the hypothesis; observations are made through the lens of the hypothesis.


Question:

Some biologists argue that before a hypothesis is framed there is an observing stage in most investigations and the resulting observations suggest what the hypothesis should be. Do you agree?

▶️Answer/Explanation

Ans: Hypotheses have to be based on something, they can be based on a theory or they can be based on a prior period of observation that results in the beginnings of a testable generalization.

Question:

Some scientific breakthroughs are the result of serendipity. This is where an observation or discovery is made by a stroke of luck rather than by careful planning. Do you know any examples of serendipitous discoveries and is modelling unnecessary in these cases?

▶️Answer/Explanation

Ans: Most famous example of serendipitous discovery is that of penicillin; the pacemaker was originally intended to record heart sounds.

Question:

What challenge does Atala mention to explain why there have been so few clinical advances in the field of regenerative medicine?

▶️Answer/Explanation

Ans: Challenges include:
Design of biomaterials that can be placed inside the body;

Getting cells to grow outside the body;

Encouraging blood vessels to develop in new tissues/organs.

Question:

What has been achieved so far and what challenges need to be surmounted?

▶️Answer/Explanation

Ans: Achievements so far include:
Production of a variety of suitable biomaterials;

Successful use of biomaterials to act as a scaffold for a new tissue/organ;

Getting many cell types to grow outside the body;

Using stem cells to produce functioning tissues such as cardiac muscle;

Production of bladders for transplant using a patient’s own stem cells;

Development of printing technology in which cells are applied in layers, in precise arrays as in natural organs;

Development of techniques for wound healing by applying cells with printing technology to a wound on a patient.

Challenges still to be surmounted include:

Producing solid organs such as kidneys;

Getting liver, nerve and pancreas cells to grow outside the body.

Question:

Describe the relationship between x and y shown in the graphs a), b) and c).

▶️Answer/Explanation

Ans: a) From x = 0 to x = 6, level of y decreases as the level of x increases/negative correlation; above x = 6 the level of y does not change as the level of x increases.

b) y increases to maxima when x approaches 2 and 7; y decreases to a minimum as x approaches 5; y decreases to zeros as x decreases below 2 and increases above 8.

c) y = 0 when x is less than 2; y increases as x increases above 2; smaller and smaller increases/y reaching a plateau/maximum when x is above 8.

Question:

Sketch a graph to show the following relationships:

a) a linear decrease in y as x is increased

▶️Answer/Explanation

Ans: Sketch graph should show a straight line decrease in y as x increases.

b) an exponential decrease in y as x is increased

▶️Answer/Explanation

Ans: Sketch graph should show a decrease in y that becomes less and less steep as x increases.

c) an accelerating decrease in y as x is increased.

▶️Answer/Explanation

Ans: Sketch graph should show a decrease in y that becomes steeper and steeper as x increases.

Question:

Suggest a biological example of each of the graphs in question 1.

▶️Answer/Explanation

Ans: a) Metabolic rate in a homeothermic/warmblooded animal as environmental temperature decreases to a level where thermogenic respiration has to begin and then has to occur at an increasing rate with further temperature decreases.
b)
Size of male salmon swimming up a river to breed (jacks and hooknoses).
c)
Effect of carbon dioxide concentration on rate of photosynthesis in plants.

Question:

Compare the mean mass of the two species at:
a) 1 tree per m2                           b) 10 trees per m2

▶️Answer/Explanation

Ans: a) Both species have a mean mass of approximately 10,000 grams at a density of one tree per m2.

b) Both species have a mean mass of approximately 200 grams at a density of ten trees per m2.

Question:

Identify which species was found:
a) growing at the highest density b) with the largest mean mass.

▶️Answer/Explanation

Ans: a) Prunus pensylvanica grew at the highest density.

b) Abies balsamea grew to the largest mass.

Question:

Discuss the evidence for a mathematical relationship between density and mean mass.

▶️Answer/Explanation

Ans: The points on the diagram suggest that the relationship can be modelled by a straight line; since the graphs use logarithmic scales, they suggest a linear relationship between log W and
log ρ (rho).

Question:

Explain how the data could be tested to see whether it fits the mathematical model that is called Yoda’s law.

▶️Answer/Explanation

Ans: The equation of the regression line for logW on log ρ can be found by entering the values of log W and log ρ into a calculator in 2variable statistics mode; the calculator will give the equation of the line in the form y = A + Bx, so logW = A + Blog ρ. If B = 3/2 (within the expected variability) then the equation is of the form W = C ρ3/2 showing that Yoda’s law fits the data; the value of C can be estimated from the graphs as log W = log C ρ3/2, so log C = A and therefore C = 10A.

Question:

A logarithmic scale has been used for both the x and y axes.

a) Explain the advantage of this for these graphs.

▶️Answer/Explanation

Ans: There are two advantages of using logarithms:
• It is possible to find the nature of the relationship, including establishing that the power of ρ is -3/2;

• Without using logarithms, it would not be possible to show such a wide range of values of W on one diagram.

b) Predict the shape of the curve if logarithmic scales had not been used.

▶️Answer/Explanation

Ans: The graph is a curve, with lower values of W for higher values of ρ, and with the gradient getting smaller as ρ increases.

Question:

If you ask the first hundred people you meet on a street to answer a questionnaire, what are the reasons for this not being a representative sample of the whole population?

▶️Answer/Explanation

Ans: Not representative; not every individual in the population has an equal chance of being encountered walking along the street; affected by where the person lives/works/whether they can
walk/how they spend their time.

Question:

Opinion polls before an election are often based on calls to voters using landline telephone numbers chosen randomly. Does this method of sampling give a representative model of a whole voting population?

▶️Answer/Explanation

Ans: Not representative; not every individual has a landline telephone; more than one person share some landlines; some landlines are used by businesses rather than private individuals.

Question:

If you needed to carry out stratified random sampling of your school community, what groups would you define as the strata within the school?

▶️Answer/Explanation

Ans: Year groups; boys and girls.

Question:

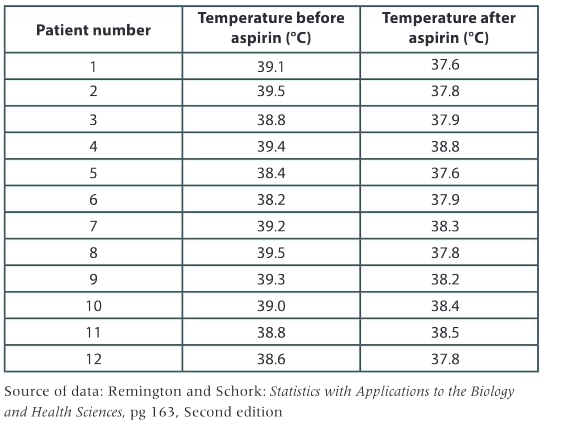
Find the range of temperatures:
a) before treatment with aspirin b) after treatment with aspirin.
c) Comment on the variation in both data sets.

▶️Answer/Explanation

Ans: a) 38.4 39.5 °C
b)
37.6 38.8 °C
c)
Data overlaps; higher maximum before treatment; lower minimum after treatment.

Question:

Find the average temperature:
a) before treatment with aspirin b) after treatment with aspirin.

▶️Answer/Explanation

Ans: a) 38.90 °C
b)
38.05 °C

Question:

Evaluate the conclusion that aspirin lowers body temperature in children. To what extent do you think that this sample data is representative of the broader population of children?

▶️Answer/Explanation

Ans: Difference in mean temperature before and after treatment; which is evidence for aspirin lowering body temperature; but the sample size was small/only 12; boys were not included; only 4
year olds were included; only flu patients were included; may not be representative of the broader population of children.

Question:

What game does this pattern remind you of: yellow beats orange; blue beats yellow and orange beats blue?

▶️Answer/Explanation

Ans: Rock paper scissors.

Question:

What name is given to the type of mathematical pattern shown in the graph?

▶️Answer/Explanation

Ans: Wave form/sinusoidal/oscillating.

Question:

Construct a pay-off matrix for the breeding success of the three colour morphs of lizard.

▶️Answer/Explanation

Ans:

Question:

Explain, with examples, what is meant by these phrases:
a) autonomous agent b) mitigation of adverse effects

▶️Answer/Explanation

Ans: a) Autonomous agent: intelligent/programmed; independent; responsive to its environment; has its own goals; and is able to pursue them.
b)
Mitigate adverse effects: reduce the severity; of the harm caused by something.

Question:

Suggest examples of:

a) overexploitation of natural resources, apart from overfishing of cod.

▶️Answer/Explanation

Ans: Excessive logging of rainforests so few trees of a particular species remain; collection of all or most wild orchids of one species; extraction of so much water from a river for irrigation that the river downstream runs dry; poaching of more elephants for ivory than are added to the population each year by reproduction.

b) adverse effects of humans on ecosystems, apart from overexploitation.

▶️Answer/Explanation

Ans: Examples of chemical pollution; light pollution; fragmentation; disturbance due to noise; drainage of wetlands; climate change/global warming; introduction of alien species; raising of sea levels; acidification of oceans.

Question:

Discuss whether it is necessary to re-run simulations in agent- based modelling, to check the outcome.

▶️Answer/Explanation

Ans: Yes; not clear if the outcome is reliable unless the simulation is rerun.

Question:

Use the graphic model to identify the sources of land as well as the resources and services that we obtain from the land.

▶️Answer/Explanation

Ans: Sources of land: cropland; forest; builtup land; shoreline.
Resources from land: energy, settlement space, plant products for food, building, paper, clothes.

Question:

The organization Global Footprint Network has a web-based tool that allows you to model how much land area it takes to support your lifestyle (www.footprintnetwork.org). Use the tool to discover your biggest areas of resource consumption and identify what you can do to “tread more lightly” on the Earth. Identify which daily activities you pursue that affect your ecological footprint the most.

▶️Answer/Explanation

Ans: Answers will vary for example international school students will find that air travel makes for the largest ecological and carbon footprint.

Question:

Every year, the organization identifies a calendar day known as “Earth overshoot day”. Suggest what this might mean and how this aspect of the model can inform a change in our practice.

▶️Answer/Explanation

Ans: It is the calculated calendar date on which humanity’s resource consumption for the year exceeds the earth’s capacity to regenerate those resources that year.

Question:

Compare the ecological footprint of countries across the globe. Explain what patterns emerge.

▶️Answer/Explanation

Ans: An interactive map can be viewed on the website of footprintnetwork.org. It indicates that Northern hemisphere high income per capita countries have the highest ecological footprint.

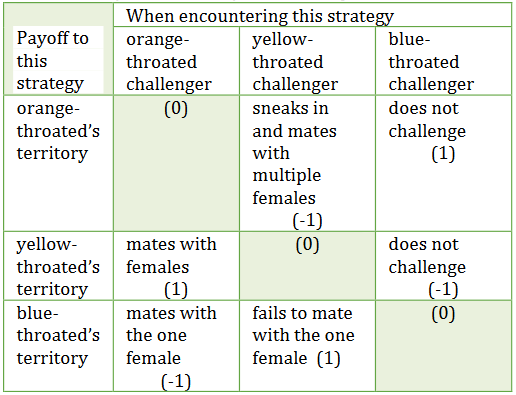
Summative assessment

Comparing forest loss in Indonesia and Brazil

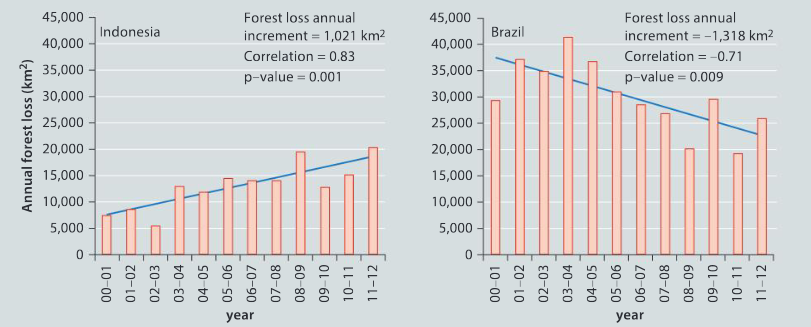
The bar charts below show annual forest loss in Indonesia and Brazil, with a correlation curve that indicates the overall trend. Three statistics are given: the mean annual increment for forest loss, a trend line showing the change in forest loss over the years (correlation curve) and the confidence level (p) of the correlation curve.

Question:

a) State the annual forest loss in both countries in:
i) 2003–04 
ii) 2008–09

▶️Answer/Explanation

Ans: i) Indonesia: 13,000 km2; Brazil: 42,000 km2
ii)
Indonesia: 19,000 km2; Brazil 20,000 km2

b) Compare and contrast forest loss in Indonesia and Brazil.

▶️Answer/Explanation

Ans: Both countries have more than 5,000 km2 of forest loss every year; forest loss fluctuates in both countries; Brazil has more forest loss throughout the study period; overall Brazil forest loss is decreasing whereas Indonesia forest loss is increasing.

c) Compare and contrast the correlation curves for Indonesia and Brazil.

▶️Answer/Explanation

Ans: Rising in Indonesia and falling in Brazil; correlation coefficient is 0.83 in Indonesia and 0.71 in Brazil; on average 1,021 more km2 of loss each year in Indonesia and 1,318 km2 less in Brazil per year; pvalue for the correlation is higher for Brazil/0.009 versus 0.001/correlation more statistically significant for Indonesia.

d) Explain what is indicated by the p-values for the two correlation curves. 

▶️Answer/Explanation

Ans: pvalue indicates the statistical significance of the correlation; the lower the pvalue the less chance that there is of no genuine correlation/the less chance that the null hypothesis is true; low pvalue for both Indonesia and Brazil so the null hypothesis can be rejected; lower pvalue for Indonesia so greater confidence.

Question:

Suggest reasons for forest loss in Indonesia and Brazil.

▶️Answer/Explanation

Ans: Clearance for: agriculture; mining; urbanization; hydroelectric schemes; logging.

Designing a FACE experiment

The map here shows the distribution of places on the Earth where forest is being lost and forest is being gained.

Question:

a) Identify two areas where forest is being lost and not gained. 

▶️Answer/Explanation

Ans: Equatorial West Africa; Madagascar; Amazonia; Siberia.

b) Identify a country where forest is being both lost and gained. Suggest how this is possible.

▶️Answer/Explanation

Ans: (Countries with areas coloured pink): Sweden; New Guinea; USA; forest clearance/deforestation in some parts of the country; afforestation in other parts.

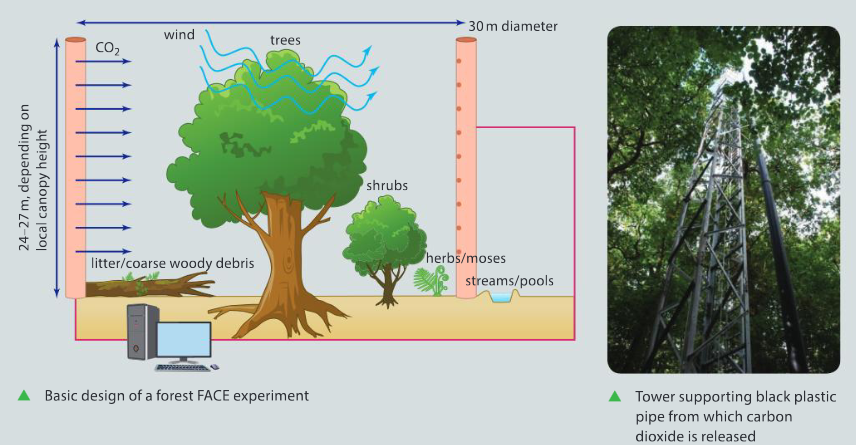
The forecast increase in atmospheric carbon dioxide concentration from 400 to 550 or more parts per million over the next century could have profound effects on forests. A series of six Free-Air Carbon dioxide Enrichment (or FACE) experiments are being set up in representative areas of natural forest around the world to simulate conditions in the forests of the future.

Question:

a) Explain how you would set up a FACE experiment, including how the forest site should be chosen, how many circular test areas you would establish and what the independent, dependent and controlled variables would be.

▶️Answer/Explanation

Ans: Choose typical natural area of forest; as many circular areas as possible in which there is carbon dioxide enrichment because costs are very high and this is enough for statistically significant results (the actual number used in FACE experiments is three); independent variable is carbon dioxide concentration; 400 ppmv/ambient and raised carbon dioxide should be tested (the actual target level is 550 ppmv); multiple dependent variables; including growth rate/photosynthesis rate of the trees/of the forest (growth is monitored using LIDAR); controlled variables kept constant by siting all circular areas in one uniform area of forest; same species of tree/size of tree/soil type/temperature/water availability/ mineral elements in soil/N/P availability; carbon dioxide from circles with enrichment must not pass to circles where there is intended to be no enrichment.

b) Discuss how effectively your model would simulate conditions in forests of the future.

▶️Answer/Explanation

Ans: Simulates carbon dioxide concentration effectively; but not global warming; or rainfall; or incidence of storms/hurricanes/floods.

Investigating forest loss using a database

Question:

Visit the website of the organization Global Forest Watch (www.globalforestwatch.org) or another database that contains information about the status of the world’s forests.

a) Choose a country.

▶️Answer/Explanation

Ans: Canada.

b) Determine how the country ranks globally in terms of tree cover loss.

▶️Answer/Explanation

Ans: Canada ranked 3rd for tree cover loss in the period 2001 2016; 36.01 hectares lost; only Russia and Brazil lost a greater area of forest; 49.51 hectares and 46.37 hectares.

c) Determine the percentage of your chosen country that is covered in trees.

▶️Answer/Explanation

Ans: 42%

d) Identify the year on record that had the greatest amount of tree cover loss. 

▶️Answer/Explanation

Ans: 2005

e) Determine how much of the country is primary forest and what percentage is regenerated forest.

▶️Answer/Explanation

Ans: 59% primary; 36% regenerated.

f) Visit the NASA fires database (https://earthdata.nasa.gov/earth-observation-data/near-real-time/firms/active-fire-data) to determine if there are any active fires in your chosen country.

▶️Answer/Explanation

Ans: At the time of writing there were forest fires in Alberta.

g) Using the websites indicated above as well as others, gather further information about the status of forests in your country.

▶️Answer/Explanation

Ans: For Canada the federal government produces additional publications on the status of Canadian forests.

h) Decide on a method of visually representing your data.

▶️Answer/Explanation

Ans: An infographic is one possible method of displaying the data.

Evaluating zoos as a model habitat

Read the article below from the National Geographic magazine and answer the questions that follow.

Question:

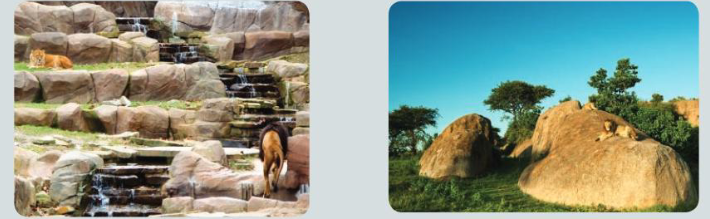
Compare and contrast the model lion habitat on the left to the actual lion habitat on the right.

▶️Answer/Explanation

Ans: Both have areas of bare rock; both have rock slopes/rocky eminences/vantage points; only the natural habitat has trees; rock in natural habitat is sloping whereas in the zoo it is stepped; zoo has water flowing down a waterfall/ artificial stream whereas the natural habitat does not; natural habitat has flat areas/areas with soil between the rock outcrops whereas the zoo only has
rock slopes/zoo habitat is less varied.

Question:

Make an actual or virtual visit to your nearest zoo. To what extent is immersive habitat technique practised?

▶️Answer/Explanation

Ans: Answers will depend on the quality of habitat provided by the local zoo.

Question:

Identify an animal that is housed in your local zoo or a zoo of your choice. Conduct research on the features of the natural habitat of that organism.

a) Compare and contrast the natural habitat of that organism with the one located at the zoo you have chosen.

▶️Answer/Explanation

Ans: Answers will depend on the quality of habitat provided by the local zoo.

b) Evaluate the habitat of the animal at the zoo you have chosen.

▶️Answer/Explanation

Ans: Answers will depend on the quality of habitat provided by the local zoo.

Scroll to Top