Question:
For each of the following case studies of habitats, identify biotic and abiotic factors, using information from the text and the accompanying images.

▶️Answer/Explanation
Ans: • Sea otter biotic factors: kelp providing shelter; coral reefs providing shelter; availability of prey/sea urchins/ molluscs/crustaceans; humans hunting for fur (in the past).
• Sea otter abiotic factors: salinity; wave action/storms; temperature of the water; beaches providing shelter; stones uses as tools; depth of water affecting kelp growth.
• Lagoon jellyfish biotic factors: zooplankton for food; algae to take into its tissues; mangrove trees for shelter/habitat.
• Lagoon jellyfish abiotic factors: sunlight; salinity; temperature of water; water depth/tides; water current.
• Spotted owl biotic factors: nest holes in large trees; smaller trees for cover; availability of prey/small mammals/squirrels/voles; predators/eagles.
• Spotted owl abiotic factors: darkness to support nocturnal hunting; sunlight to support biomass of habitat.
• Elfcup fungus biotic factors: availability of deadwood/fallen trees; availability of poplar/aspen/oak/ash trees.
• Elfcup fungus abiotic factors: water for saprotrophic nutrition; sufficient warmth for decomposition.
Trees growth
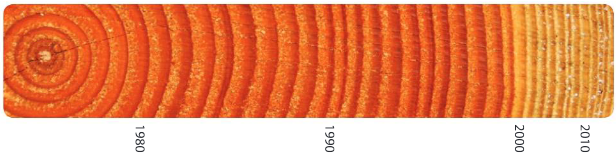
The photograph below shows a 40-year sequence of rings from a Douglas fir (Pseudotsuga menziesii). It grew in a plantation that was thinned periodically by felling some of the trees. The start of each annual ring is light and the end is dark. Four of the rings are dated.
Question:
Starting with 1980, measure the width of the annual ring for each year and record the value in a table.
▶️Answer/Explanation
Ans: All rows and columns with headings; ring thickness measured in millimetres; each measurement in a separate cell on the table.
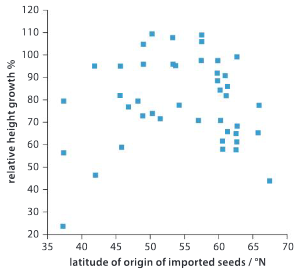
Pine trees are widely grown to produce timber. Young trees are raised by collecting seeds from mature trees and germinating them. A growth study was carried out on a site at a latitude of 57°, in the Highlands of Scotland. Trees were grown using local seeds collected from Pinus sylvestris trees near the trial site and from seeds collected from trees of the same species in others parts of Europe.
The growth in height of the trees per year was measured. The scatter graph shows the latitude of each seed source and the growth, in height, of trees raised from it. The growth in height of trees grown from imported seeds is shown as a percentage of the growth in height of the trees raised from local seeds.
Question:
Identify the relationship between latitude of origin and growth:
a) between 35° and 57
▶️Answer/Explanation
Ans: The higher the latitude of origin of the seeds the greater the growth.
b) between 57° and 70°
▶️Answer/Explanation
Ans: The higher the latitude of origin of the seeds the lower the growth.
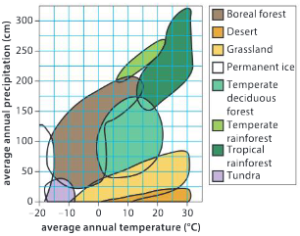
Using the graph, answer the following questions:
Question:
What type of plant community will develop at an average annual temperature of 15°C and average annual precipitation of 150 cm?
▶️Answer/Explanation
Ans: Temperate deciduous forest.
Question:
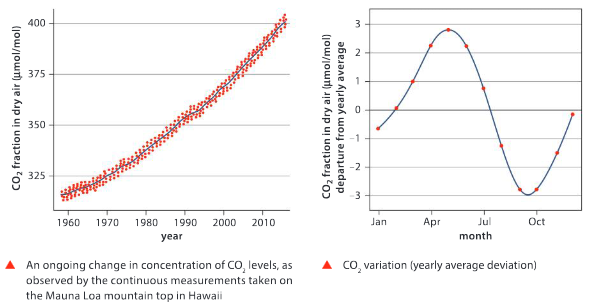
a) Outline how the concentration of carbon dioxide has changed over the time period measured.
Ans: Carbon dioxide concentration has risen from 315 in 1958 to 400 micromoles per mole in 2015.
▶️Answer/Explanation
b) What factors are contributing to this rise?
Ans: Burning fossil fuels; coal/oil/gas; burning forests.
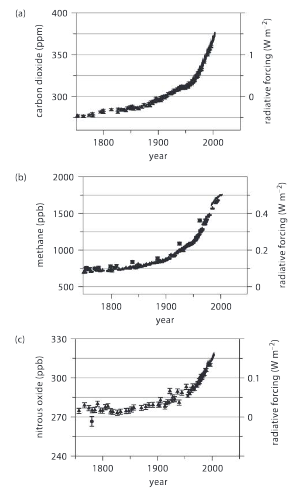
Changes in atmospheric concentrations of greenhouse gases have been investigated using some of the research methods described in Chapter 7, which allow scientists to gain an understanding of how the climate changed over the last 700,000 years.
The following graphs show the concentrations of three greenhouse gases since 1750, expressed either as parts per million (ppm) or part per billion (ppb).
Question:
a) Using the three graphs, determine the concentrations of each of the gases in the year 2000.
▶️Answer/Explanation
Ans: Carbon dioxide: 375 ppm;
Methane: 1750 ppb;
Nitrous oxide: 315 ppb
b) Calculate the percentage increase of each gas since 1750.
▶️Answer/Explanation
Ans: Carbon dioxide: [375 – 275)/275] × 100% =36.4%
Methane: [(1750 – 750)/750) × 100% = 133.3%
Nitrous oxide: (315 – 275 / 275) × 100% = 14.5%
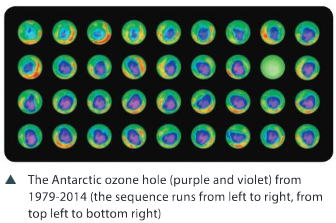
Chemicals released by humans, especially chlorofluorocarbons (CFCs) from aerosol cans and other devices, caused large decreases in ozone in the stratosphere, particularly over Antarctica. The Antarctic ”ozone hole” increased in size from the late 1970s to the early 21st century, but throughout the stratosphere ozone concentrations decreased and more UV radiation penetrated to the Earth’s surface.
Question:
Based on the data below, when did the ozone hole reach its maximum size?
▶️Answer/Explanation
Ans: In the years from 2000 to 2011.
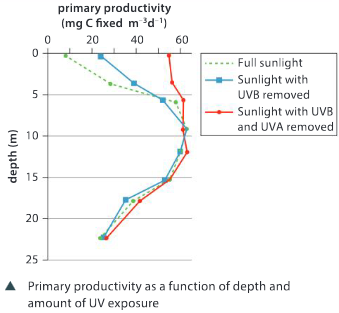
The effects of UV on phytoplankton in the Antarctic Ocean have been investigated. UVA has wavelengths of 315 to 400 nm and UVB from 280 to 315 nm. Primary production due to phytoplankton photosynthesis was measured at different depths both in full sunlight and with either UVB, or UVA and UVB removed.
Question:
a) Explain the evidence, provided by the data in the graph, for ultraviolet light harming phytoplankton.
▶️Answer/Explanation
Ans: Higher primary productivity by phytoplankton near the ocean surface if UV is removed; removal of both UVA and UVB increases productivity; no difference in productivity at greater depths where UV doesn’t penetrate.
b) Using the data in the graph, discuss whether UVA or UVB causes more harm.
▶️Answer/Explanation
Ans: UVA has more effect; greater increment in productivity with UVA removed than with UVB only removed.
c) Predict, with reasons, the effects of ultraviolet light on marine food chains in the Antarctic Ocean.
▶️Answer/Explanation
Ans: Less food for zooplankton; less food for predators of zooplankton; less energy flow along food chains; shorter food chains.
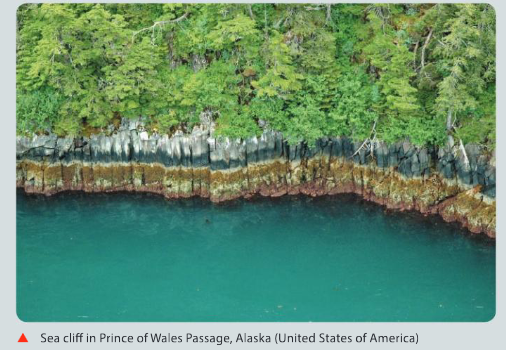
Project ShoreZone aims to record habitats along coastlines throughout the world; the images it produces are truly beautiful as well as being scientifically useful. The photograph shown here is of the clear zonation that can be observed on the cliffs in Alaska’s Prince of Wales Passage. From the waterline upwards, we can distinguish
zones of red-brown colored barnacles (Semibalanus cariosus), then yellow-brown seaweeds (Fucus distichus), black lichen (Verrucaria maura) and above that spruces and other trees and shrubs.
Question:
Suggest reasons for:
a) barnacles not growing higher up on the cliff
▶️Answer/Explanation
Ans: Barnacles filter feed in seawater; would be out of seawater for too long each day if they lived higher.
b) lichens or seaweeds growing only on the middle part of the cliff
▶️Answer/Explanation
Ans: Would not get enough light if they were in deep water for too much of each day.
c) trees and shrubs not growing lower down on the cliff.
▶️Answer/Explanation
Ans: Cannot tolerate inundation by saline seawater; water drawn out of roots by osmosis.
Trees and air pollution
Question:
The air in urban areas contains a variety of pollutants, including particles of solids and gases. The table below shows the level of air pollution in urban areas of New York and rural areas nearby.
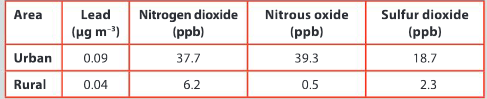
Compare the levels of atmospheric pollution in urban and rural areas.
▶️Answer/Explanation
Ans: More pollutants in urban areas; more lead, nitrogen dioxide, nitrous oxide and sulfur dioxide.
Question:
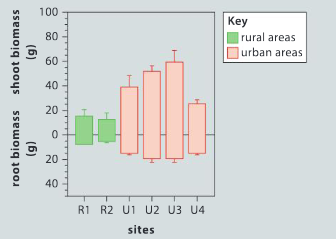
Tree planting has been suggested as a way of improving air quality in urban areas. The growth of Populus deltoides in urban and rural areas near New York was investigated. Trees were grown in pots containing the same type of soil in all areas. High levels of mineral nutrients in the soil ensured that lack of nutrients was not the limiting factor on growth rates. The growth of the trees above ground (shoot biomass) and below ground (root biomass) was measured after one year. The bar chart below shows the results for two rural areas (green bars) and four urban areas (red bars).
a) Evaluate the methods used in the investigation, especially the manipulation and control of variables.
▶️Answer/Explanation
Ans: Same type of soil; all trees grown in pots; mineral elements at high levels so not the limiting factor on growth; temperature presumably not controlled; water not mentioned but presumably not limiting.
b) Evaluate the method of presentation of data in the bar chart. Can you suggest any improvements?
▶️Answer/Explanation
Ans: Bar chart is suitable as the independent variable is categoric; error bars are helpful to show variability of the data; colour helps to distinguish data for rural and urban areas; grid on graph would make it easier to read off values.
c) Outline the conclusions that can be drawn about the growth of Populus deltoides from the data in the bar chart.
▶️Answer/Explanation
Ans: Less growth in rural areas than urban; for both roots and shoots.
d) Discuss whether the differences in growth rates of Populus deltoides between urban and rural areas could be due to differences in the concentration of air pollutants.
▶️Answer/Explanation
Ans: Could not be due to lead, NOX or sulfur dioxide; as they are all higher in urban areas; unlikely that air pollutants promote growth.
Question:
a) The histograms below show the range of ozone exposure between May and September in urban and rural areas near New York. Compare the ozone exposures in urban, agricultural and forested areas
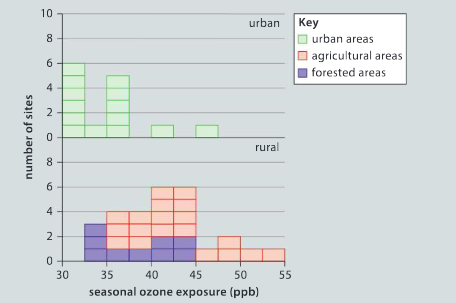
▶️Answer/Explanation
Ans: Lower ozone on average in urban areas; agricultural areas have higher ozone on average than forested.
b) The concentrations of ozone and the shoot growth of Populus deltoides were measured at eight sites. The results are shown in the scatter graph below. Using the data in the scatter graph and in previous parts of this question, suggest a hypothesis for differences in the growth of Populus deltoides between urban and rural areas. Give reasons for your hypothesis.
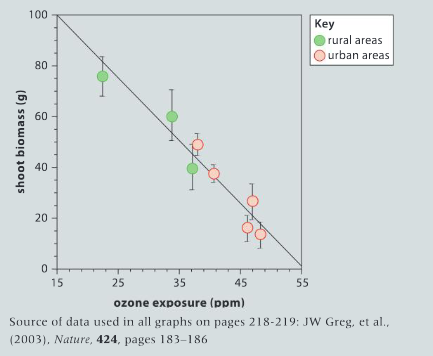
▶️Answer/Explanation
Ans: Lower growth of Populus deltoides in rural areas because they have higher ozone concentrations; and ozone inhibits growth.
Question:
Trees are able to remove pollutants from the air and either store them in their biomass or trap them on their surfaces. This map shows the pollution removed by trees in counties across the US.
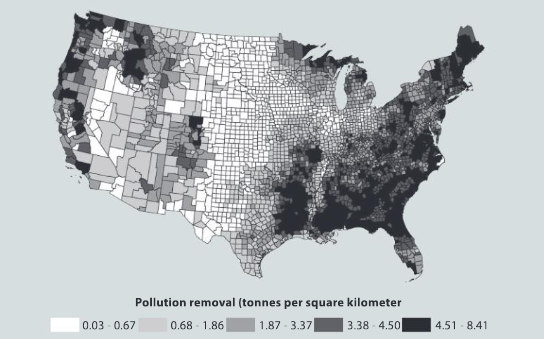
a) Generate two hypotheses to explain the trends observed.
▶️Answer/Explanation
Ans: Areas with higher removal of air pollutants have higher air pollution; areas with higher removal of air pollutants have more trees.
b) Choose one of these hypotheses and explain carefully a procedure that could be used to test it.
▶️Answer/Explanation
Ans: Obtain data on numbers of trees per area; obtain data on concentrations of air pollutants; look for correlations with pollution removal data.
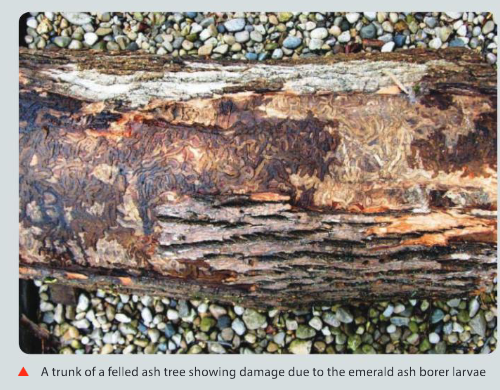
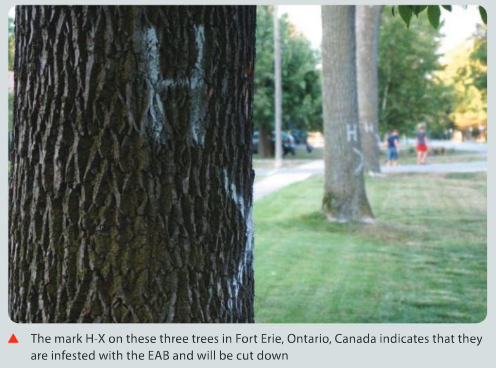
The emerald ash borer invasion
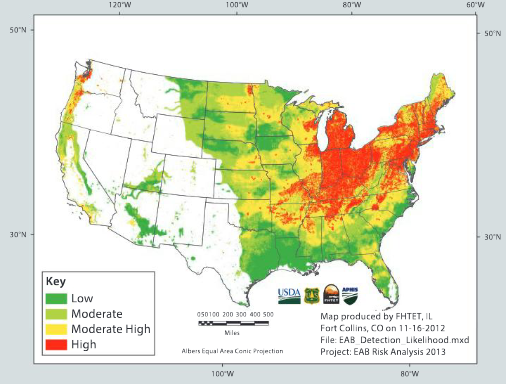
The emerald ash borer (Agrilus planipennis) is an invasive alien insect in large parts of Canada and the United States, where it has killed over 100 million trees. Affected areas of the United States are shown in the map below.
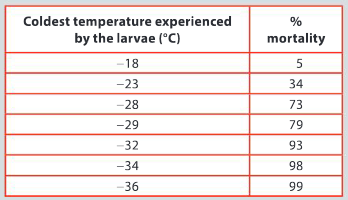
Larvae of the insect reside inside the tree over winter and emerge the next season. Cold weather not only kills many larvae, but also limits the development of others, leading to a two-year life cycle, which slows down population growth. The table shows the results of an experiment in which percentage mortality of the larvae was tested over a range of sub-zero temperatures.
Question:
a) Identify the parts of the United States that are most significantly affected by the emerald ash borer.
▶️Answer/Explanation
Ans: Indiana/Ohio/Michigan/states in New England.
b) Display the data in the table using the type of chart or graph that you consider most suitable.
▶️Answer/Explanation
Ans: Line graph; coldest temperature experienced on the x–axis and % mortality on the y–axis; scale and legend on both axes; points all plotted correctly; points joined with a line.
c) Choose one of the heavily infested US states. Using an online database, find the coldest winter temperatures over a range of years and determine whether they have been cold enough to
limit the reproduction of the emerald ash borer. Report your findings.
▶️Answer/Explanation
Ans: Heavily infested state chosen and named; coldest winter temperature found; correct conclusion about whether emerald ash borer could survive.
d) Suggest a possible consequence if the average minimum winter temperature were to increase in the region of the infestation.
▶️Answer/Explanation
Ans: Numbers of emerald ash borer would rise.
e) Inquire into whether a warming trend has occurred in the regions of the United States most affected by the emerald ash borer. You could look at historical monthly minimum temperatures from meteorological databases.
▶️Answer/Explanation
Ans: Temperature data for one of the most affected states obtained and quoted; conclusion stated relating to any warming trend discovered.
f) If you find evidence of a warming trend, outline the reasons for it.
▶️Answer/Explanation
Ans: Unless there are specific local reasons for a warming trend, the reasons should relate to an enhanced greenhouse effect: emissions of carbon dioxide/greenhouse gases; from burning of fossil fuels; methane from landfill sites/rice cultivation/ruminant digestion; nitrogen oxides fertilizer use/fossil fuel combustion/biomass burning/vehicle exhausts.
The impacts of the emerald ash borer
The Audubon Society of North America has been sponsoring an annual Christmas Bird Count (CBC) in the month of December for over 100 years. The results are stored in a public database that can be readily accessed online (http://netapp.audubon.org/cbcobservation/). In some years there may have been many people counting birds, but fewer participants in other years, and fluctuations in raw count numbers may be partly due to this. One way to standardize CBC data over time is to use the number of birds reported per party hour (a measure of the amount of time spent searching for birds or the amount of effort expended).
The emerald ash borer infestation is likely to have an impact on bird populations. Choose one of the hypotheses below and test it using the CBC database, filtering your search by location to focus on the Great Lakes region.
● The emerald ash borer infestation provides food for birds that eat insects inside trees so these birds increase in numbers.
● The death of ash trees will reduce the food supply of birds that feed on ash seeds so these birds decrease in numbers.
Question:
Write an account of what you have found in your investigation, using appropriate scientific language.
▶️Answer/Explanation
Ans: Award marks on a scale from 0 marks for an account that is entirely lacking in merit to 5 marks for a clear, succinct and convincing account that uses appropriate scientific language.
Question:
The Department of Environmental Conservation of New York State has posted an online article titled ”Immerse Yourself in a Forest for Better Health”, in which claims are made about the health benefits of forests. All the claims are backed up by references to published scientific research. For example, a reference is given to research indicating that the death of trees due to emerald ash borer is associated with over 20,000 extra deaths from heart and lung disease in 15 US states.
a) Explain the importance of references to published scientific research when making claims.
▶️Answer/Explanation
Ans: Shows that there is evidence for claims; allows the evidence to be checked.
b) One of the references is this: Donovan, G., Butry, D., Michael, Y., Prestemon, J., Liebhold, A., Gatziolis, D., Mao, M. (2013).The Relationship Between Trees and Human Health: Evidence from the Spread of the EAB.American Journal of Preventive Medicine. 44(2):139-45. Find the abstract of this research and summarize it, using language that non-scientists could understand.
▶️Answer/Explanation
Ans: Award marks on a scale from 0 marks for a summary that is inaccurate, misleading or incomprehensible to 3 marks for a clear summary that a non–scientist could understand.