Data-based question: Car testing
A car manufacturer is testing a new design of car. They want to know how much CO2 is emitted for every kilometer it drives. They test it three times and get measurements of 147 g km–1, 157 g km–1 and 143 g km–1.
Question:
What is the average amount of CO2 emitted per kilometer driven?
▶️Answer/Explanation
Ans: \(frac{147+157+143}{3}=149 g km^{-1}\)
Question:
The manufacturer states that the car emits less than 150 g km–1. Is this a reliable statement?
▶️Answer/Explanation
Ans: The statement is true in that the average amount of CO2 emitted per kilometer driven (149) is less than 150 g km–1. However, it is not reliably true as one of the tests gave a reading higher than 150 g km–1.
Question:
Assess the following statements to determine their accuracy and precision.
● The world’s population is about ten billion people.
● The Moon orbits the Earth every 27.322 days.
● The speed of light is 289,792,458 m s–1
● There are over a million different languages spoken on Earth.
▶️Answer/Explanation
Ans: World population – accurate, not precise (statement is true to nearest ten billion – 1 significant figure); Moon orbit – accurate and precise; Speed of light – not accurate, but precise (second digit is incorrect); Languages spoken – not accurate nor precise (there are approximately 7000 languages).
Question:
The trumpeters played a note with a frequency of 698 Hz. If the speed of sound is 340 m s–1, using the physics you learned in Chapter 1, Models, calculate the wavelength of the sound waves
coming from the trumpet.
▶️Answer/Explanation
Ans: (frac{340}{698}=0.49 m)
Question:
Calculate the time period between successive waves.
▶️Answer/Explanation
Ans: (frac{1}{698}=1.43 ms)
Question:
The train traveled at 16 m s–1. How far would the train travel in the time of one time period?
▶️Answer/Explanation
Ans: 16 × 1.43 × 10–3 = 2.3 × 10⁻² m
Question:
For a person standing on the station, the wavelength of the waves (calculated in question 1) would be shorter by an amount calculated in question 3 because each successive wave is emitted at a closer distance by that much. Calculate the wavelength of the waves as heard by a person on the station.
▶️Answer/Explanation
Ans: 0.49 – 2.3 × 10–2 = 0.47 m
Data-based question: Edwin Hubble’s data
This is a graph of Edwin Hubble’s original data. The gradient of this graph is called Hubble’s constant. It has units of kms–1Mpc–1
Question:
Find the gradient of this graph.
▶️Answer/Explanation
Ans: 586 km s–1 Mpc–1 (accept range 580 to 595)
Question:
Comment on the reliability of the trend.
▶️Answer/Explanation
Ans: Reliable as the data points follow the trend well (or accept unreliable, as many data points lie away from the trend line).
Question:
The accepted value of Hubble’s constant is 72kms–1Mpc–1. What does this suggest about the validity of Hubble’s original experiment?
▶️Answer/Explanation
Ans: The original Hubble constant was around a factor of 10 out. This suggests that the method was invalid (Hubble’s original method for measuring the distances to galaxies was flawed).
Question:
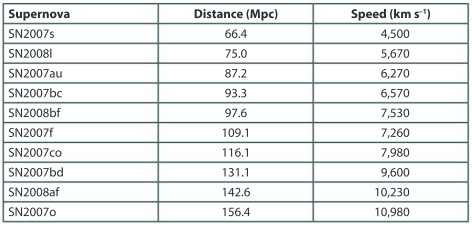
Plot a graph of the data with distance in Mpc on the x-axis and speed in kms–1 on the y-axis.
▶️Answer/Explanation
Ans: 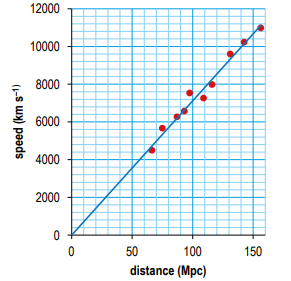
Question:
Describe the trend of the data.
▶️Answer/Explanation
Ans: Strong linear trend.
Question:
Add a line of best fit to your graph. The gradient of the graph is the Hubble constant. Find the value of the gradient.
▶️Answer/Explanation
Ans: 70 km s–1 Mpc–1
Question:
Comment on the reliability of the trend.
▶️Answer/Explanation
Ans: Reliable as most of the data points are close to the line of best fit and there are no clear anomalies. (accept reverse argument).
Summative assessment
Using the radar gun
The radar gun emits radio waves of a known frequency. These bounce off the moving car and back to the radar gun which detects them. The frequency of these waves is measured. If the car is moving towards the radar gun, the detected frequency is higher than the original frequency.
Question:
State the word used to describe what happens when waves bounce off a surface.
▶️Answer/Explanation
Ans: Reflection
Question:
The radar gun uses radio waves with a frequency of 1.8 × 10¹⁰ Hz. The radio waves travel at the speed of light (3 × 10⁸ m s–1). Calculate the wavelength of these radio waves.
▶️Answer/Explanation
Ans: (frac{3times 10^{8}}{1.8times 10^{10}}=0.02 m)
Question:
The Doppler shift of the radio waves depends on the speed of the car compared to the speed of the radio waves. A 100% change in frequency occurs if the car is traveling at the same speed as the waves; a 50% change occurs if the speed of the car is half that of the radio waves. Explain why only a very small change in frequency would be expected to be detected from this radar gun.
▶️Answer/Explanation
Ans: Speed of radio waves from the radar gun is very high (3 × 10⁸ m s–1); the speed of the car relative to the wave speed will be very low; speed of the car is a tiny fraction of the wave speed; this fraction corresponds to the percentage change in frequency, hence a very small change in frequency would be expected from the radar gun.
a) A car is traveling towards the radar gun at 50kmh–1. Express this as a fraction of the speed of light
▶️Answer/Explanation
Ans: 50 km h–1 = 13.89 m s–1; (frac{13.89}{3times 10^{8}}=4.63times 10^{-8})
b) The change in the detected frequency will be this fraction of the original frequency. Calculate the change in frequency.
▶️Answer/Explanation
Ans: 1.8 × 1010 × 4.63 × 10–8 = 833 Hz
c) Describe how the wavelength of the received radio waves has changed from the emitted wavelength.
▶️Answer/Explanation
Ans: Frequency has increased, wave speed remains the same; c = f𝜆 so wavelength is inversely proportional to frequency; this means that wavelength must have decreased.
d) Describe how the change in frequency would be different if the car was traveling away from the radar gun.
▶️Answer/Explanation
Ans: The detected frequency would be lower than the original frequency; The frequency will change by the same fraction as if the car were moving towards the radar gun.
Calibrating the speed camera
The radar gun is tested on cars traveling at known speeds. The graph below shows the frequency of the detected radio waves against the speed of the car
Question:
a) Describe an experiment that might be used to produce this graph.
▶️Answer/Explanation
Ans: Award marks for: Sensible method; includes a suitable range of speeds; includes zero speed; method of measuring speed; frequency of emitted waves is measured; frequency of reflected waves is measured; repeats taken.
b) Identify one suitable control variable in this experiment and explain how it might be controlled.
▶️Answer/Explanation
Ans: Credit any sensible suggestion with a suitable method of controlling the variable, for example:
- The frequency of waves produced by the radar gun should remain constant;
- This can be controlled by using the same radar gun.
Question:
Explain why the radar gun could not be used to measure the speed of the car. Describe a different method that could be used to establish the car’s speed.
▶️Answer/Explanation
Ans: Appreciation that calculating the value of the independent variable using the dependent variable would not result in an experiment; independent variable and dependent variable must be measured independently so that any relationship between them can be explored. Or idea that experiments are used to test a theory.
Suitable method of measuring speed such as timing over a fixed distance; Suitable measurements with measuring instruments are described; any calculations required are described.
Question:
Describe the trend of this graph.
▶️Answer/Explanation
Ans: Directly proportional.
Question:
Comment on the reliability of the data. Explain how might the reliability be improved.
▶️Answer/Explanation
Ans: The data is reliable as it follows a strong linear trend; To improve reliability more repeats could be taken, allowing an average to be calculated for each data point.
Question:
Find the gradient of the graph.
▶️Answer/Explanation
Ans: Line of best fit used to calculate gradient; gradient = 120 Hz m–1 s (allow ±5)
Question:
The detector is only capable of measuring the frequency of the waves to the nearest 100 Hz. If the speed limit is 20 m s–1 , what speed would the radar gun have to detect in order to be confident that the car was going faster than this speed limit?
▶️Answer/Explanation
Ans: The change in frequency that corresponds to 20 m s–1 is 2400 Hz (allow 2500 Hz); measurement is only ±100 Hz (allow ±50); 2,500 Hz would be consistent with 20 m s–1; radar gun would have to detect 2,600 Hz (consistent with assumptions above) to be confident of a speed greater than 20 ms–1.
Question:
A car causes the radar gun to detect a shift of 1800 Hz (measured to the nearest 100 Hz). The speed limit is 40 km h–1 but it is normal not to prosecute a speeding driver unless their speed is
10% greater than this. Evaluate the evidence and decide whether there is enough evidence to suggest that the car was speeding.
▶️Answer/Explanation
Ans: Calculation of speed from change in frequency; consideration of measurement to nearest 100 Hz; conversion to km h–1; consideration of 10%; conclusion.
For example:
A change of 1,800 Hz corresponds to 15 m s–1; radar gun only measures to the nearest 100 Hz so the change in frequency could have been as low as 1,700 Hz (accept 1750); at 1,700 Hz, the car is travelling at 14 m s–1 which is equivalent to 50.4 km h–1; 10% above speed limit is 44 km h–1; since 50.4 > 44, evidence is that the car was speeding.
Avoiding being caught by speed cameras
Some motorists install radar detectors to detect the radio waves coming from the radar gun. This warns them if there is a speed trap ahead and gives them time to slow down to avoid being caught.
Question:
Discuss how you might design a radar gun to avoid this problem.
▶️Answer/Explanation
Ans: Credit any sensible suggestions. For example:
- Fire the radio waves in the direction of the traffic motion. Cars will not detect radio waves until they are closest to the radar gun.
- Use a radar gun which is switched on only when the motorist is close enough for their speed to be detected. The motorist would not be able to detect the radar gun in advance and would not be able to slow down.
- Use a different frequency of radio waves that is not compatible with current radar detectors. This would make the radar gun harder to detect.
Question:
Comment on the ethics of avoiding speed cameras.
▶️Answer/Explanation
Ans: Credit sensible arguments. Points might include:
- Speed cameras are installed along roads for safety purposes.
- They ensure that motorists are driving at an appropriate speed for their surroundings.
- By avoiding speed cameras and driving at an inappropriate speed, the motorist is potentially endangering themselves, pedestrians and other motorists.
- This is especially relevant in certain settings, for example around a school, where road hazards may constantly be changing.
- It is usually not ethical to avoid speed cameras.
Question:
Many speed cameras have a back-up measurement of the speed. This works by taking two photos separated by a known interval of time. Lines on the road, a set distance apart, help to determine the position of the car in each picture.
a) Explain why it is important to have a back-up measurement when gathering evidence of a car exceeding the speed limit.
▶️Answer/Explanation
Ans: A repeat measurement increases reliability of data; there could be mistakes in measurements if only one set of data is taken. This could lead to speeding cars being missed or motorists wrongly being accused of speeding; a second measurement would confirm the validity of the first.
b) Describe, using scientific language appropriately, how the two photos may be used to determine the speed of the car.
▶️Answer/Explanation
Ans: The time interval between the capturing of the two photos is measured. The lines on the road can be used to determine the position of the car in each photo; from this, the distance travelled by the car in this time interval can be determined; dividing this distance by the time interval will give the average speed of the car during this time interval.