Trophic Levels (Producers to Quaternary Consumers)
What Are Trophic Levels?
A trophic level is a step in a food chain or web. It shows an organism’s position in the feeding hierarchy – what it eats and what eats it.
Energy flows from one level to the next, beginning with sunlight and producers.
The Energy Flow: Level by Level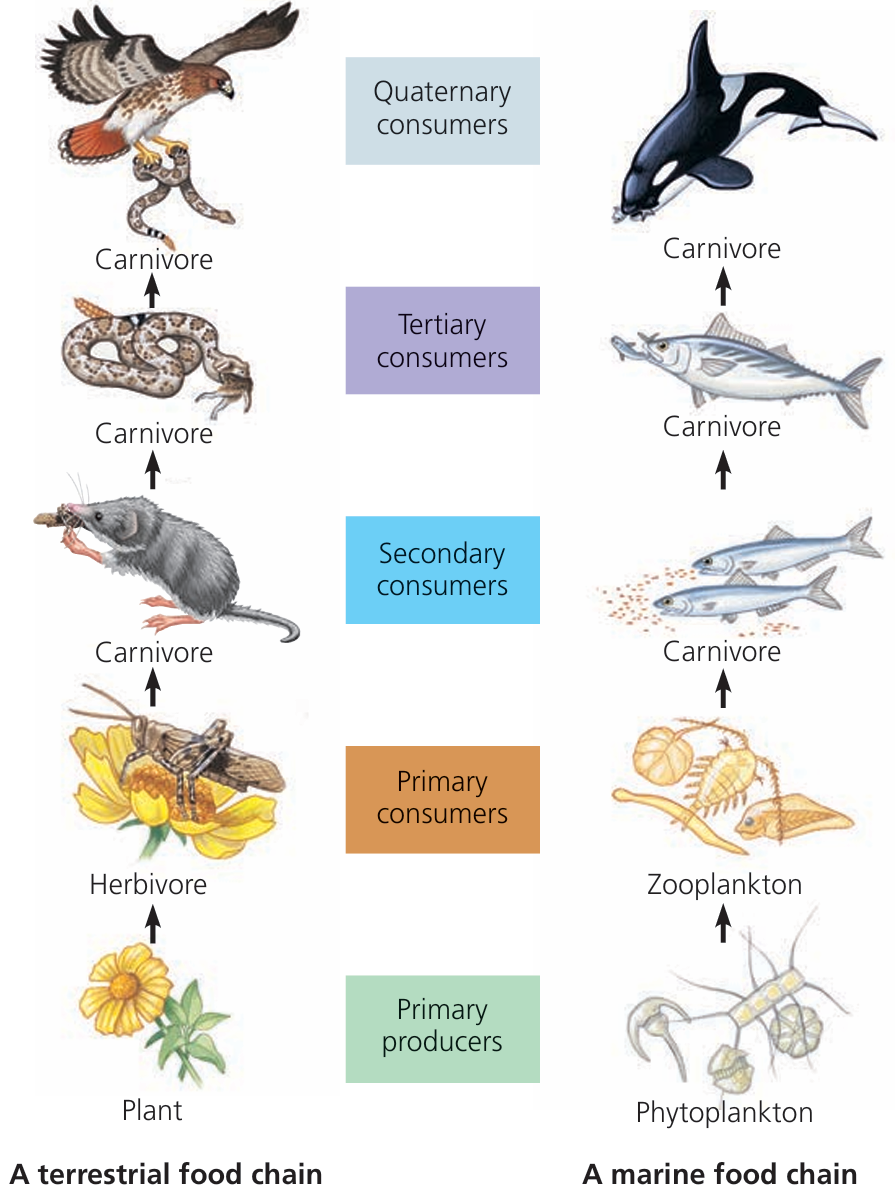
1. Producers (Trophic Level 1)
- Make their own food by photosynthesis
- Start of the food chain
- Provide energy for all other levels
2. Primary Consumers (Trophic Level 2)
- Herbivores – eat producers
- Transfer plant energy to the next level
3. Secondary Consumers (Trophic Level 3)
- Carnivores or omnivores
- Eat primary consumers
4. Tertiary Consumers (Trophic Level 4)
- Top predators in many ecosystems
- Eat secondary consumers
5. Quaternary Consumers (Trophic Level 5)
- Very top predators with few or no natural enemies
- Rare and exist in small numbers
Quick Table: Trophic Levels at a Glance
| Trophic Level | Name | What It Eats | Example Organism |
|---|---|---|---|
| 1 | Producer | Sunlight (photosynthesis) | Grass, algae |
| 2 | Primary Consumer | Producer | Grasshopper, cow |
| 3 | Secondary Consumer | Primary Consumer | Frog, fish, snake |
| 4 | Tertiary Consumer | Secondary Consumer | Hawk, fox, large fish |
| 5 | Quaternary Consumer | Tertiary Consumer | Lion, shark, killer whale |
Why Energy Decreases at Each Level
– The rest is lost as heat, movement, and waste
– This limits how many levels can exist
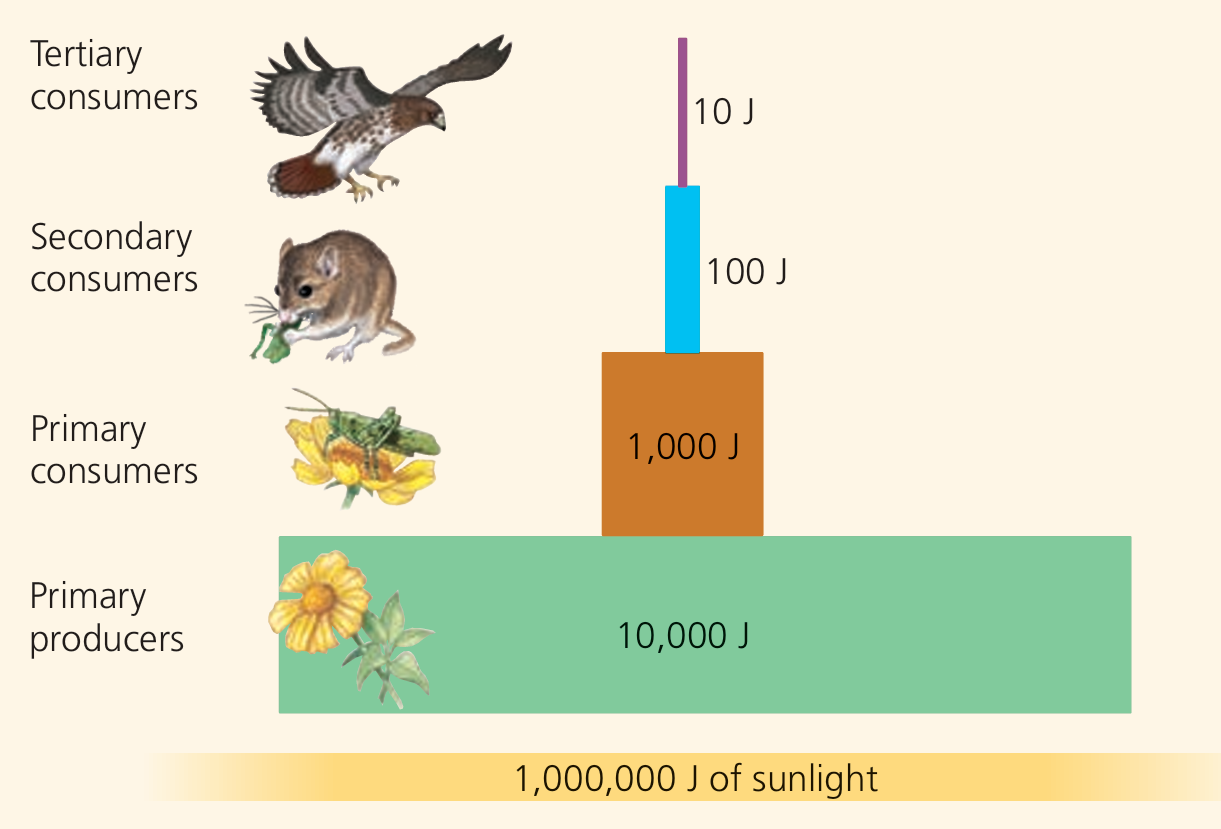
This is called the 10% Rule of Energy Transfer
Energy Pyramid Concept
– Narrow top = Quaternary consumers → least energy, fewest numbers
– Each level represents energy loss up the chain
Energy Transfer and the 10% Rule
In every food chain, energy flows from one organism to another – but not all of it gets passed on. As energy moves through trophic levels, a large portion is lost. This explains why food chains are short and why top predators are few in number.
Energy Flow in a Food Chain
Energy enters ecosystems through sunlight. Plants (producers) convert sunlight into chemical energy via photosynthesis. That energy moves up the food chain from:
- Producers → Primary consumers → Secondary consumers → Tertiary consumers

At each step, some energy is passed on — but most of it is used up or lost as:
- Heat from respiration
- Movement and activity
- Waste (urine, faeces)
- Undigested materials (bones, hair, etc.)
The 10% Rule in Action
| Trophic Level | Energy Available | Example |
|---|---|---|
| Producers | 1000 units | Grass |
| Primary Consumers | 100 units | Grasshopper |
| Secondary Consumers | 10 units | Frog |
| Tertiary Consumers | 1 unit | Snake |
Why Are There Fewer Top Predators?
Due to the loss of energy at every level, there’s not enough energy left to support many organisms at the top. This is why:
- Top predators are fewer in number
- Food chains are usually only 4-5 levels long
- Producers form the widest base in energy pyramids
Fun fact: A lion may indirectly depend on thousands of grass plants for energy – through zebras, antelopes, and other herbivores it eats!
Final Takeaway
The 10% Rule explains how energy loss shapes ecosystems. It limits how many organisms can survive at each trophic level and why producers are the foundation of all food chains.
Pyramids of Numbers, Biomass, and Energy
Ecological pyramids are visual models that show the structure of a food chain. They help us understand how energy, mass, and organism numbers are distributed across different trophic levels – from producers to top predators.
Definition: An ecological pyramid shows the relationship between different trophic levels in terms of either:
- Number of organisms
- Total biomass
- Energy transfer
Pyramid of Numbers
Shows the count of individual organisms at each trophic level.
- Producers usually outnumber consumers, forming a wide base.
- Exception: A single large producer (like a tree) may support many herbivores.
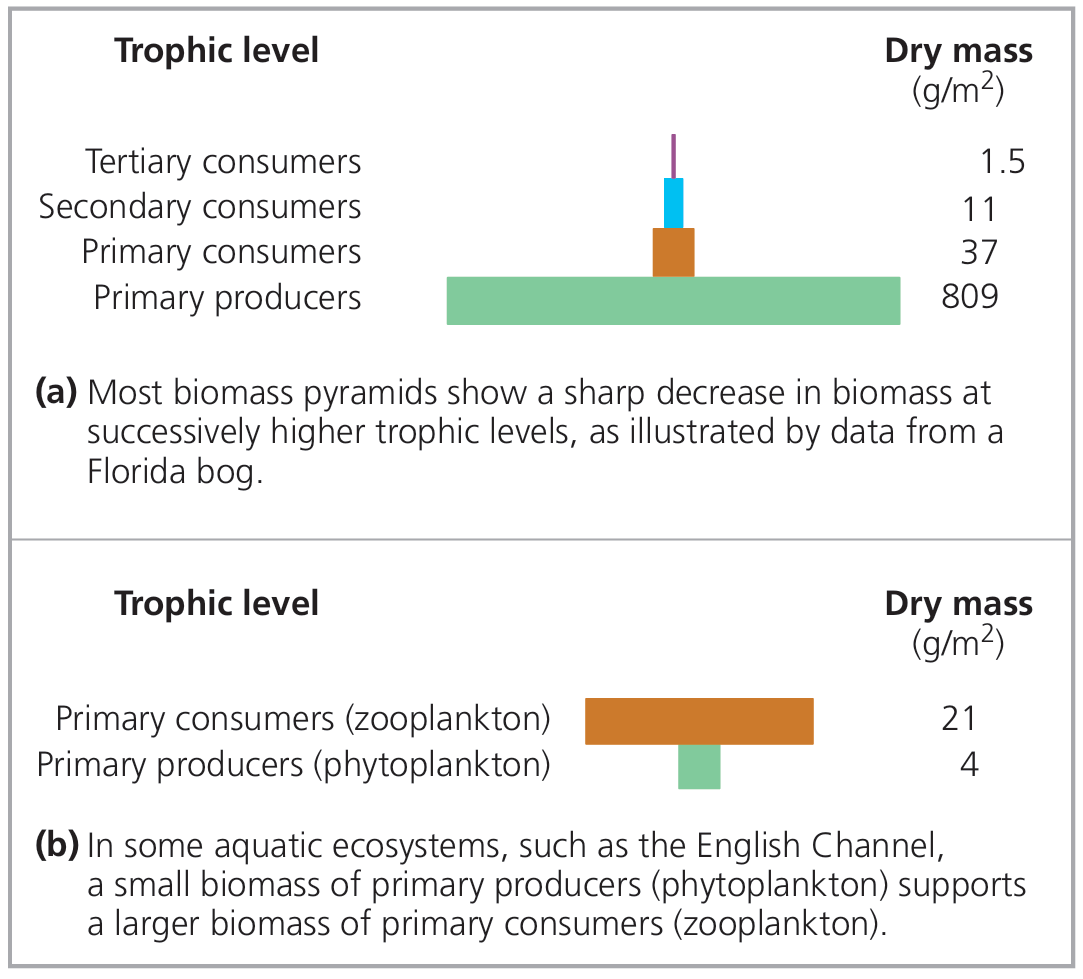
Pyramid of Biomass
Shows the total mass (dry weight) of living organisms at each level. Measured in grams per square metre (g/m²).
- Always wider at the bottom (more mass in producers).
- Gets narrower at the top as you move up the food chain.
Organisms use energy for respiration, and not all parts (bones, shells) are consumed or digested.
Pyramid of Energy
This is the most accurate pyramid. It shows the amount of energy transferred at each level over time (e.g., kJ/m²/year).
- Always upright – energy always decreases up the pyramid.
- Follows the 10% rule – only ~10% of energy passes to the next level.
Comparison Table
| Pyramid Type | What It Shows | Can It Be Inverted? |
|---|---|---|
| Numbers | Number of organisms at each level | Yes |
| Biomass | Total mass of living matter | Rarely |
| Energy | Energy transferred between levels | Never |
Summary:
Pyramids help visualize how ecosystems work – whether it’s in terms of numbers, mass, or energy. Among them, the energy pyramid is the most reliable, clearly showing how energy is lost at each step of a food chain.