Question 1: Box and Whisker Plot Interpretation [6 marks]
In this task (questions 1 to 5), you will interact with different aspects of form using a variety of related concepts. This task focuses on criterion A (Knowing and understanding) and criterion C (Communication).
Interpret the box and whisker plot to answer given questions.
The box and whisker plot given below illustrates the average annual snowfall for resorts on the given two mountains for the past 25 years.
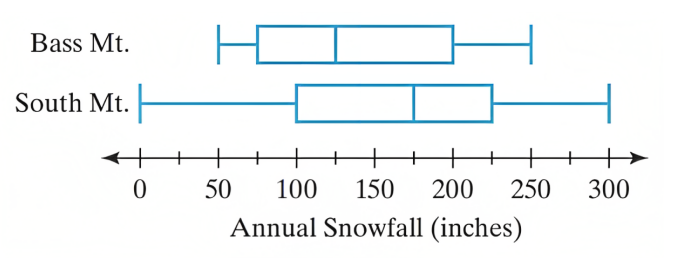
Note: The box plot shows Bass Mountain with median at 150 inches (Q1=100, Q3=200), and South Mountain with median at 100 inches (Q1=50, Q3=150). Whiskers extend to 50-250 inches for Bass Mountain and 0-200 inches for South Mountain.
a Write down the median snowfall for both the mountains. [2 marks]
▶️Answer/Explanation
Understanding Box Plots:
The median is represented by the line inside the box of the box-and-whisker plot.
For Bass Mountain:
- The median line is at 150 inches on the scale
- This means half of the years had less than 150 inches of snowfall, and half had more
For South Mountain:
- The median line is at 100 inches on the scale
- This represents the middle value of snowfall over the 25 years
Final Answer:
Bass Mountain median snowfall: 150 inches
South Mountain median snowfall: 100 inches
b Determine the interquartile range of snowfall for both the mountains. [1 mark]
▶️Answer/Explanation
Understanding Interquartile Range (IQR):
IQR = Q3 (upper quartile) – Q1 (lower quartile), represented by the length of the box.
For Bass Mountain:
- Q1 (left edge of box) = 100 inches
- Q3 (right edge of box) = 200 inches
- IQR = 200 – 100 = 100 inches
For South Mountain:
- Q1 = 50 inches
- Q3 = 150 inches
- IQR = 150 – 50 = 100 inches
Final Answer:
Both mountains have an interquartile range of 100 inches.
c Determine the least amount of snowfall that was recorded on Bass Mountain. [1 mark]
▶️Answer/Explanation
Understanding Box Plot Whiskers:
The left whisker represents the minimum value (excluding any outliers).
For Bass Mountain:
- The left whisker extends to 50 inches on the scale
- This represents the least amount of snowfall recorded in the 25-year period
- There are no outliers shown below this point
Final Answer:
The least snowfall recorded on Bass Mountain was 50 inches.
d Considering the fact that you like snow, state the mountain you would choose for a ski trip. Justify your choice. [3 marks]
▶️Answer/Explanation
Comparative Analysis:
When choosing between the two mountains for a ski trip with preference for more snow, consider:
| Metric | Bass Mountain | South Mountain |
|---|---|---|
| Median Snowfall | 150 inches | 100 inches |
| Maximum Snowfall | 250 inches | 200 inches |
| Minimum Snowfall | 50 inches | 0 inches |
Justification for Choosing Bass Mountain:
- Higher median snowfall (150 vs 100 inches) means better average conditions
- Greater maximum snowfall (250 vs 200 inches) offers potential for exceptional snow years
- More consistent snow – even in worst years, still gets 50 inches vs South Mountain’s 0 inches
- Same IQR indicates similar variability, but Bass Mountain’s distribution is shifted higher
Final Answer:
I would choose Bass Mountain because it has consistently higher snowfall (median of 150 inches vs 100 inches) and never drops below 50 inches, ensuring better snow conditions for skiing throughout the season.
Syllabus Reference
Unit 6: Statistics & Probability
- Interpretation of box plots
- Measures of central tendency (median)
- Measures of dispersion (IQR, range)
- Comparative data analysis
Assessment Criteria: A (Knowing and understanding), C (Communication)