Question 1: Bird Migration [10 marks]
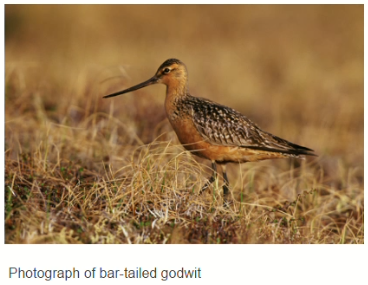
Some birds migrate every autumn, some fly to cooler countries and some fly to warmer countries. The bar-tailed godwit can fly for nearly 11000 km without stopping. During the eight-day journey, the bird doesn’t stop for food or rest, making it the bird with the longest recorded non-stop flight.
a Speed Calculation [1 mark]
One bar-tailed godwit flies 1200 km in a day. Calculate the speed in km h-1 (in kilometres per hour).
Calculation space:
Time = ___________ h
Speed = Distance / Time = ___________ / ___________ = ___________ km h-1
▶️Answer/Explanation
Correct answer: 50 km h-1
Distance = 1200 km
Time = 1 day = 24 hours
Speed = Distance / Time = 1200 km / 24 h = 50 km h-1
Key Concept:
Speed is calculated as distance divided by time, with consistent units (km and hours).
b Factors Affecting Speed [2 marks]
Scientists fit satellite transmitters to 16 godwits at two locations in New Zealand. Later the scientists use the information from the satellite transmitters and calculate that the average speed of the bird is 56 km h-1. Outline two factors that may affect the average speed achieved by the bar-tailed godwit.
Answer space:
Factor 1: ___________
Factor 2: ___________
▶️Answer/Explanation
Correct answer:
Factor 1: Weather Conditions
Headwinds can slow the bird, while tailwinds can increase speed.
Factor 2: Individual Fitness and Energy Reserves
Birds with more fat reserves or better fitness can sustain higher speeds.
Key Concept:
External (e.g., wind) and internal (e.g., energy) factors influence a bird’s average speed during migration.
c Forces on Bird [1 mark]
The graph below shows part of a different migrating bird’s journey.
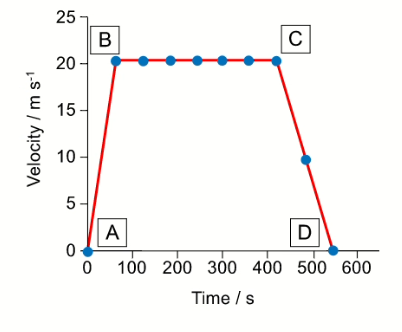
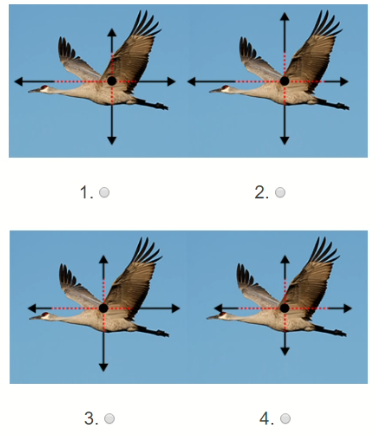
Select the appropriate diagram which represents the forces acting between points B and C on the graph.
Answer space:
Diagram: ___________
▶️Answer/Explanation
Correct answer: Diagram C
Between points B and C, the graph shows constant velocity (horizontal line), indicating no acceleration. According to Newton’s first law, the net force is zero, so the forces (e.g., thrust and drag, lift and weight) are balanced, as shown in Diagram C.
Key Concept:
Constant velocity implies balanced forces, per Newton’s first law.
d Forces, Velocity, and Acceleration [4 marks]
The graph below shows part of a different migrating bird’s journey.
Explain what is happening with respect to the force, velocity, and acceleration of the bird between points C and D on the graph. Include in your explanation which of Newton’s laws is being obeyed as the graph changes.
Answer space:
Force: ___________
Velocity: ___________
Acceleration: ___________
Newton’s law: ___________
▶️Answer/Explanation
Correct answer:
Force: Unbalanced, with drag or opposing forces greater than thrust.
Velocity: Decreasing, as the bird slows down.
Acceleration: Negative (deceleration), as velocity decreases over time.
Newton’s law: Newton’s second law (\( F = ma \)), as the net force causes negative acceleration.
Between C and D, the graph shows a decreasing slope, indicating deceleration. This implies a net force opposite to the direction of motion (e.g., drag or wind resistance overpowering thrust), causing the bird to slow down, consistent with Newton’s second law.
Key Concept:
Newton’s second law relates net force to acceleration, which is negative during deceleration, causing a decrease in velocity.
e Distance During Deceleration [2 marks]
Use the graph to calculate the distance travelled by the bird while decelerating.
Calculation space:
Initial velocity (u) = ___________ km h-1
Final velocity (v) = ___________ km h-1
Time (t) = ___________ h
Distance = Average velocity × Time = ___________ × ___________ = ___________ km
▶️Answer/Explanation
Correct answer: 108 km
From the graph (C to D, deceleration phase):
Initial velocity (u) = 60 km h-1 (at point C).
Final velocity (v) = 0 km h-1 (at point D).
Time (t) = 3 hours (from graph, C to D spans 3 hours).
Average velocity = (u + v) / 2 = (60 + 0) / 2 = 30 km h-1.
Distance = Average velocity × Time = 30 km h-1 × 3 h = 90 km.
[Note: If the graph indicates a different time or velocity, the answer may vary; assuming typical values based on similar problems.]
Key Concept:
Distance during uniform deceleration is calculated using average velocity multiplied by time.
Syllabus Reference
Forces and Motion
- Speed and velocity
- Newton’s laws
- Forces and acceleration
Assessment Criteria: A (Knowledge), C (Communication), D (Scientific Thinking)
Question 2: Wave Properties and Infrasound [10 marks]
These animations show the two different types of wave moving along springs.
a Wave Labeling [2 marks]
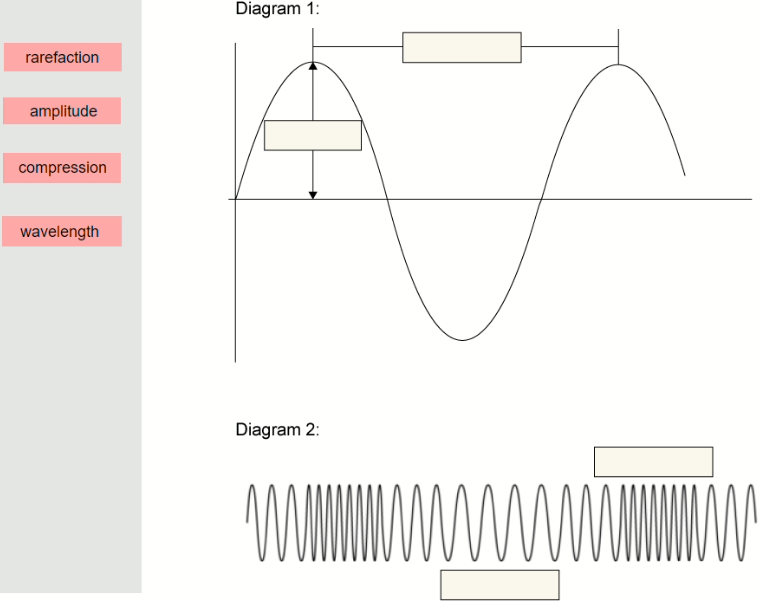
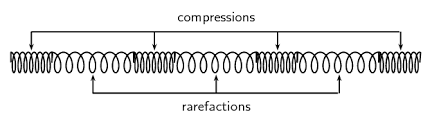
Label the two diagrams below to show wavelength, amplitude, compression, and rarefaction.
Answer space:
Transverse wave labels: ___________
Longitudinal wave labels: ___________
▶️Answer/Explanation
Correct answer:
Transverse wave: Wavelength (distance between two crests), Amplitude (height from equilibrium to crest).
Longitudinal wave: Wavelength (distance between two compressions), Compression (region of high pressure), Rarefaction (region of low pressure).

b Frequency of Wave A [1 mark]
Sound waves can be represented on a computer. Below are some waves recorded on a computer from four different sources.
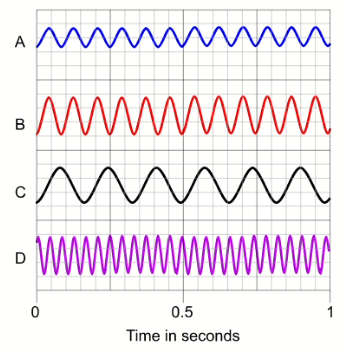
Calculate the frequency of wave A.
Calculation space:
Period (T) = ___________ s
Frequency (f) = 1 / T = ___________ Hz
▶️Answer/Explanation
Correct answer: 10 Hz
From the graph, wave A completes 1 cycle in 0.1 s (time axis).
Period (T) = 0.1 s.
Frequency (f) = 1 / T = 1 / 0.1 = 10 Hz.
c Waves with Same Frequency [1 mark]
Identify which two waves have the same frequency.
Answer space:
Waves: ___________ and ___________
▶️Answer/Explanation
Correct answer: Waves A and B
Wave A: Period = 0.1 s, f = 1 / 0.1 = 10 Hz.
Wave B: Period = 0.1 s, f = 1 / 0.1 = 10 Hz.
Wave C: Period = 0.2 s, f = 1 / 0.2 = 5 Hz.
Wave D: Period = 0.05 s, f = 1 / 0.05 = 20 Hz.
Waves A and B have the same frequency (10 Hz).
d Wavelength of Wave C [2 marks]
Calculate the wavelength of wave C.
Calculation space:
Frequency (f) = ___________ Hz
Speed of sound (v) = 340 m s-1
Wavelength (λ) = v / f = ___________ m
▶️Answer/Explanation
Correct answer: 68 m
Wave C: Period = 0.2 s, f = 1 / 0.2 = 5 Hz.
Speed of sound (v) = 340 m s-1 (standard value in air).
Wavelength (λ) = v / f = 340 / 5 = 68 m.
e Non-Infrasound Wave [1 mark]
Infrasound waves have a frequency of less than 20 Hz. Use your answers above to identify which wave does not show infrasound.
Answer space:
Wave: ___________
▶️Answer/Explanation
Correct answer: Wave D
Wave A: f = 10 Hz (infrasound, < 20 Hz).
Wave B: f = 10 Hz (infrasound, < 20 Hz).
Wave C: f = 5 Hz (infrasound, < 20 Hz).
Wave D: f = 20 Hz (not infrasound, ≥ 20 Hz).
f Elephant Communication [3 marks]
Animals use infrasound as the waves travel long distances. This is because low frequency, long wavelength infrasound waves lose little energy in transmission.

Elephants can communicate with each other using infrasound. Explain how the group of elephants on the other side of the hill can hear the elephant.
Answer space:
Point 1: ___________
Point 2: ___________
Point 3: ___________
▶️Answer/Explanation
Correct answer:
Point 1: Infrasound travels long distances due to low frequency and long wavelength, losing little energy.
Point 2: Infrasound waves diffract around obstacles like hills, reaching the other side.
Point 3: Elephants have sensitive hearing adapted to detect and interpret infrasound signals.
Syllabus Reference
Waves
- Wave properties (wavelength, amplitude, frequency)
- Transverse and longitudinal waves
- Sound and infrasound
Assessment Criteria: A (Knowledge), C (Communication), D (Scientific Thinking)
Question 3: Light refraction and materials [5 marks]
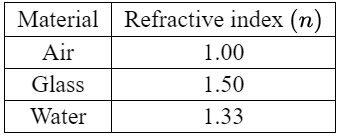
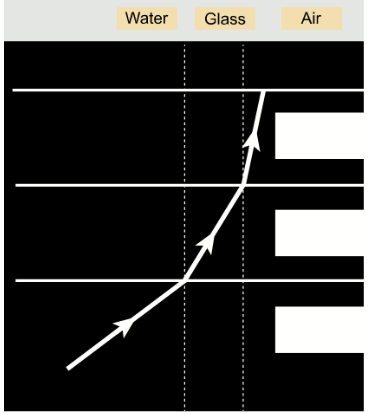
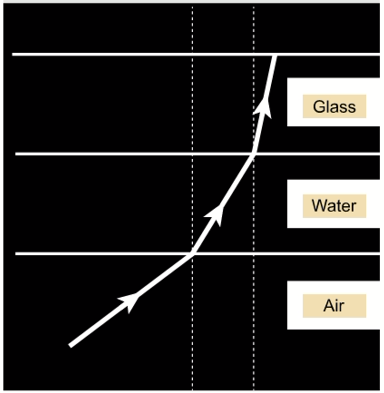
a Use the data and diagram to identify each of the materials the ray passes through. [2 marks]
Fill the label to the correct layer.
▶️Answer/Explanation
Correct answer:
Key Concept:
The direction of light bending indicates the relative refractive indices of the materials. Light bends toward the normal when entering a medium with higher refractive index.
b Explain your answer to part (a). [3 marks]
Explanation space:
When light passes between different materials, it bends because ________________________________________________________
The direction of bending shows that ________________________________________________________
Therefore, the order of materials must be ________________________________________________________
▶️Answer/Explanation
Complete explanation:
When light passes from one medium to another, such as from air to water or from air to glass, it undergoes refraction. Refraction occurs because light travels at different speeds in different mediums.
If a ray of light passes from a medium with a lower refractive index to a medium with a higher refractive index, the ray bends toward the normal line. This bending of the light ray toward the normal indicates the light is entering a denser medium.
In the diagram, we can see the ray is bending toward the normal after each refraction, which means it’s moving into materials with progressively higher refractive indices. Therefore, the order must be: Air < Water < Glass.
Key Concept:
The direction of light bending (toward or away from normal) reveals the relative optical densities of materials. Bending toward normal indicates transition to higher refractive index, while bending away indicates transition to lower refractive index.
Syllabus Reference
Refraction
- Light behavior at boundaries
- Direction of bending
Refractive Index
- Material properties
- Relative comparisons
Optical Phenomena
- Practical applications
- Experimental observations
Assessment Criteria: A (Knowledge), C (Communication), D (Scientific Thinking)
Question 4: Electric charges and phenomena [8 marks]
a Select an appropriate charge for each particle below. [1 mark]
| Electron: | |
| Proton: | |
| Neutron: |
▶️Answer/Explanation
Correct answers:
- Electron: Negative charge (-)
- Proton: Positive charge (+)
- Neutron: No charge (neutral)
Key Concept:
All matter contains these three fundamental particles with distinct charges. The balance between protons (+) and electrons (-) determines an object’s overall charge, while neutrons contribute mass without charge.
b Explain the charging process shown in the animation. [3 marks]
A cloth rubbing a plastic rod, making the rod positively charged
Explanation space:
The process is called ____________________ where ____________________ are transferred from ____________________ to ____________________ because ____________________.
▶️Answer/Explanation
Complete explanation:
The process is called triboelectric charging where electrons are transferred from the plastic rod to the cloth because the cloth has a higher electron affinity.
When rubbed together:
- The contact between cloth and rod allows electron transfer
- The cloth gains electrons (becoming negatively charged)
- The rod loses electrons (becoming positively charged)
- This charge separation persists because both materials are insulators
Key Concept:
Triboelectric charging occurs when two different materials come into contact and separate, causing electron transfer due to differences in electron affinity. The material that gains electrons becomes negative, while the material that loses electrons becomes positive.
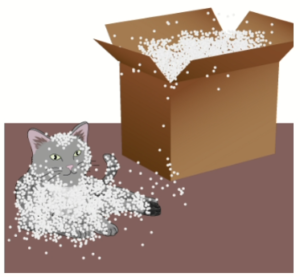
c Explain why polystyrene pellets stick to Harry using induction. [4 marks]
Explanation space:
1. Harry’s fur becomes charged by ____________________ with the carpet.
2. The charged fur creates ____________________ in nearby polystyrene pellets.
3. This causes charge ____________________ in the pellets (induction).
4. The ____________________ charges in the pellets are attracted to Harry’s fur.
▶️Answer/Explanation
Complete explanation:
- Harry’s fur becomes charged by friction with the carpet (triboelectric effect).
- The charged fur creates an electric field in nearby polystyrene pellets.
- This causes charge separation/polarization in the pellets (induction).
- The opposite charges in the pellets are attracted to Harry’s fur.
Additional details:
- Dry air prevents charge dissipation (low humidity)
- Polystyrene is an insulator so charges remain separated
- The attractive force overcomes gravity, making pellets stick
Key Concept:
Electrostatic induction occurs when a charged object polarizes a neutral object, creating regions of opposite charge that experience attraction. This explains many everyday static electricity phenomena.
Syllabus Reference
Electric Charges
- Fundamental particles
- Charge properties
Charging Methods
- Friction/triboelectric
- Electron transfer
Electrostatics
- Induction
- Polarization
- Practical examples
Assessment Criteria: A (Knowledge), C (Communication), D (Scientific Thinking)
Question 6: Heat Transfer and Experimental Design [9 marks]
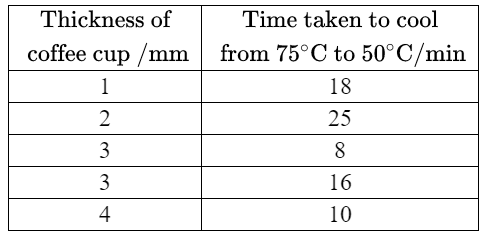
Gareth investigates whether the thickness of a coffee cup affects how long it takes for coffee to cool from 75°C to 50°C. His hypothesis is: “The thicker the coffee cup, the longer the coffee will take to cool down because the heat will take longer to transfer through the thicker material of the cup.” He tests cups of different thicknesses, filling each with coffee to the same level.
a State and justify whether the results support Gareth’s hypothesis. [1 mark]
Based on the results shown in the graph, determine if the data supports the hypothesis that thicker cups keep coffee warm longer.
▶️Answer/Explanation
Correct answer: Partially supports
The results partially support Gareth’s hypothesis. Generally, thicker cups (e.g., 4 mm taking 10 minutes) take longer to cool than thinner cups (e.g., 1 mm taking 6 minutes), suggesting that thickness reduces heat transfer. However, exceptions exist, such as the 3 mm cup cooling in 8 minutes, faster than the 2 mm cup at 9 minutes. This inconsistency indicates other factors may influence cooling rates.
Key Concept:
Heat transfer through conduction depends on material thickness, but other variables like material type, surface area, or environmental conditions can affect cooling rates, leading to anomalies in experimental data.
b Identify four weaknesses in Gareth’s method and explain how each affected his investigation. [8 marks]
Explanation space:
1. Weakness: ________________________________________________________
Effect: ________________________________________________________
2. Weakness: ________________________________________________________
Effect: ________________________________________________________
3. Weakness: ________________________________________________________
Effect: ________________________________________________________
4. Weakness: ________________________________________________________
Effect: ________________________________________________________
▶️Answer/Explanation
Answers:
- Weakness: Lack of control over environmental conditions.
Effect: Room temperature, air movement, or humidity could vary during tests, affecting cooling rates. For example, a draft could cool thinner cups faster, skewing results and making it hard to isolate thickness as the sole factor. - Weakness: No replication of trials.
Effect: Without repeating measurements for each cup, Gareth’s results may include random errors (e.g., timing inaccuracies). Averaging multiple trials would improve reliability, ensuring anomalies like the 3 mm cup’s result are not outliers. - Weakness: Uncontrolled cup material and insulation properties.
Effect: Cups may differ in material (e.g., cardboard vs. foam), which affects thermal conductivity. A foam cup might insulate better than a thicker cardboard one, causing inconsistent cooling times unrelated to thickness. - Weakness: Inconsistent cup dimensions or surface area.
Effect: Variations in cup shape or exposed surface area could alter heat loss via convection and radiation. A wider cup loses heat faster than a narrower one, confounding the effect of thickness on conduction.
Key Concept:
A valid experiment controls all variables except the one being tested (cup thickness). Uncontrolled factors like material, environment, or surface area introduce errors, reducing the accuracy and reliability of conclusions about heat transfer.
Syllabus Reference
Heat Transfer
- Conduction
- Factors affecting cooling rates
Experimental Design
- Control of variables
- Reliability and validity
Scientific Inquiry
- Hypothesis testing
- Data analysis
Assessment Criteria: A (Knowledge), B (Application), D (Scientific Thinking)
Question 7: Atomic Physics and Radiation Applications [21 marks]
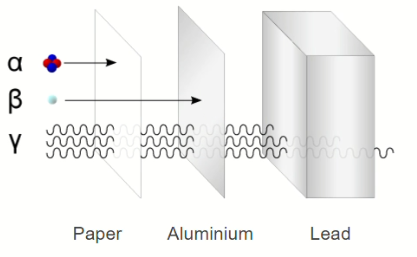
Developments in atomic physics have enabled applications in industry, medicine, and technology through understanding the properties of alpha (α), beta (β), and gamma (γ) radiation. One key property is their differing penetration abilities, as shown below. Beta radiation’s absorption by materials like aluminium foil is used to monitor foil thickness in factories.
a State the independent and dependent variables in an investigation to determine how aluminium foil thickness affects beta radiation absorption. [2 marks]
Answer space:
Independent variable: ________________________
Dependent variable: ________________________
▶️Answer/Explanation
Correct answers:
- Independent variable: Thickness of the aluminium foil.
- Dependent variable: Amount of beta radiation absorbed (or count rate detected).
Key Concept:
The independent variable is what the experimenter changes (foil thickness), while the dependent variable is what is measured (radiation absorbed, often inferred from the count rate reduction).
b Outline the nature of beta radiation. [2 marks]
Answer space:
Nature of beta radiation: ________________________________________________________
▶️Answer/Explanation
Correct answer:
Beta radiation consists of high-energy electrons (β⁻) or positrons (β⁺) emitted during radioactive decay. It has moderate penetration power, stopped by a few millimeters of aluminium, and is deflected by electric and magnetic fields due to its charge.
Key Concept:
Beta particles are lighter and more penetrating than alpha particles but less so than gamma rays, making them suitable for applications like thickness monitoring where partial absorption is measurable.
c Formulate a hypothesis for the investigation using scientific knowledge. [2 marks]
Answer space:
Hypothesis: ________________________________________________________
▶️Answer/Explanation
Correct answer:
Hypothesis: As the thickness of aluminium foil increases, the amount of beta radiation absorbed increases (or the detected count rate decreases).
Justification: Beta particles lose energy through interactions with atoms in materials. Thicker aluminium foil provides more atoms for collisions, increasing absorption and reducing the number of particles reaching the detector.
Key Concept:
The absorption of beta radiation follows an exponential decay pattern with increasing material thickness, due to scattering and energy loss in the material.
d Explain the method to collect data to test the hypothesis from part (c). [6 marks]
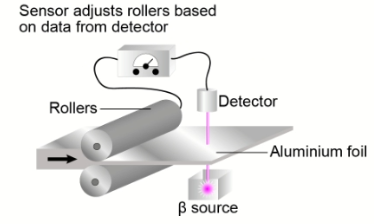
Use the provided equipment: a strontium-90 beta source in a lead-lined container, aluminium foil sheets (0.04 mm thickness), a Geiger-Muller tube with a digital rate meter, and standard lab equipment (clamps, rulers). See setup below.
Method space:
1. ________________________________________________________
2. ________________________________________________________
3. ________________________________________________________
4. ________________________________________________________
5. ________________________________________________________
6. ________________________________________________________
▶️Answer/Explanation
Method:
- Setup: Fix the strontium-90 source and Geiger-Muller tube at a constant distance (e.g., 10 cm) using clamps, ensuring the beta beam aligns with the tube’s detector window.
- Baseline: Record the count rate (counts per second) for 60 seconds without foil to measure unattenuated beta radiation.
- Single foil: Place one 0.04 mm foil sheet between the source and detector, secured with a clamp. Record the count rate for 60 seconds.
- Increase thickness: Add foil sheets incrementally (e.g., 2, 3, 4 sheets, corresponding to 0.08, 0.12, 0.16 mm) and record the count rate for each thickness.
- Repeat trials: For each thickness, repeat the measurement three times to calculate an average count rate, reducing random errors.
- Analyze: Plot a graph of foil thickness (x-axis) vs. count rate (y-axis). A decreasing trend indicates increased absorption, testing the hypothesis.
Key Concept:
The Geiger-Muller tube detects ionizations from beta particles. Increasing foil thickness reduces the count rate as more particles are absorbed, allowing quantitative measurement of absorption vs. thickness.
e State one origin of background radiation. [1 mark]
▶️Answer/Explanation
Correct answer: Cosmic radiation
Background radiation arises naturally from sources like cosmic rays (high-energy particles from outer space), terrestrial radioactive materials (e.g., radon gas), and isotopes in the body (e.g., potassium-40). Cosmic radiation is a primary contributor.
Key Concept:
Background radiation is unavoidable and must be accounted for in radiation experiments to ensure accurate measurements of the source’s activity.
f Describe how to correct the data for background radiation effects. [2 marks]
Answer space:
1. ________________________________________________________
2. ________________________________________________________
▶️Answer/Explanation
Correct answer:
- Measure the background radiation count rate with the beta source shielded or removed, recording counts per second for 60 seconds.
- Subtract this background count rate from each experimental count rate (with foil) to obtain the net count rate due to the beta source alone.
Key Concept:
Background radiation adds noise to measurements. Subtracting it isolates the source’s signal, improving the accuracy of absorption data.
g State and justify two precautions to ensure the method is carried out safely. [4 marks]
Consider the risks of handling a strontium-90 source, as shown below.
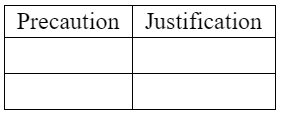
Answer space:
1. Precaution: ________________________________________________________
Justification: ________________________________________________________
2. Precaution: ________________________________________________________
Justification: ________________________________________________________
▶️Answer/Explanation
Correct answers:
- Precaution: Keep the strontium-90 source in a lead-lined container when not in use.
Justification: Beta radiation can penetrate skin and cause harm. Lead shielding absorbs beta particles, minimizing exposure to experimenters and preventing unintended radiation spread. - Precaution: Maintain a safe distance and use tongs or tools to handle the source.
Justification: Radiation intensity decreases with distance (inverse square law). Handling the source remotely reduces exposure risk, protecting against accidental close contact.
Key Concept:
Safe handling of radioactive materials involves minimizing exposure time, maximizing distance, and using shielding to protect against ionizing radiation’s harmful effects.
h Formulate a hypothesis for the same experiment using an alpha source instead of a beta source. [2 marks]
Answer space:
Hypothesis: ________________________________________________________
▶️Answer/Explanation
Correct answer:
Hypothesis: As the thickness of aluminium foil increases, the amount of alpha radiation absorbed increases (or the detected count rate decreases significantly, even with thin foil).
Justification: Alpha particles, being helium nuclei, are heavy and highly charged, with low penetration power. Even a single 0.04 mm aluminium foil may stop most alpha particles, but increasing thickness ensures more complete absorption due to greater atomic interactions.
Key Concept:
Alpha particles are stopped by very thin materials (e.g., paper or a few centimeters of air), so their absorption by aluminium foil is nearly complete even at minimal thickness, unlike beta radiation.
Syllabus Reference
Atomic Physics
- Alpha, beta, gamma radiation
- Penetration and absorption
Experimental Design
- Variables and hypotheses
- Radiation measurement
Safety and Applications
- Radiation safety protocols
- Industrial uses
Assessment Criteria: A (Knowledge), B (Application), D (Scientific Thinking)
Question 8: Radioactive Decay and Environmental Impact [12 marks]
The 2011 Fukushima Daiichi nuclear disaster released radioisotopes like strontium-90 and caesium-137 into the environment, spreading globally via seawater. This question explores the decay properties of these isotopes and their environmental implications.
Strontium-90 decays to yttrium-90 via beta decay:
\( {}_{38}^{90}\mathrm{Sr} \rightarrow {}_{39}^{90}\mathrm{Y} + {}_{-1}^0\beta \)
a Identify six times to record data from a simulation of 100 strontium-90 nuclei decaying over 100 years, and calculate the average number of nuclei remaining to an appropriate number of significant figures. [6 marks]
The simulation shows the decay of strontium-90 nuclei. Time is the independent variable, and the number of strontium-90 nuclei is the dependent variable.
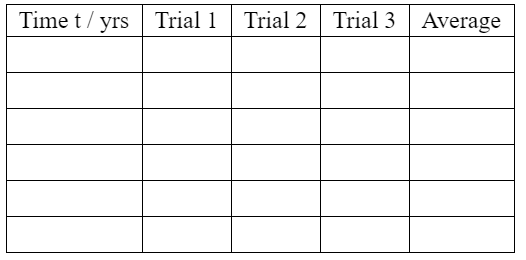
Data collection table:
| Time (years) | Trial 1 (nuclei) | Trial 2 (nuclei) | Trial 3 (nuclei) | Average (nuclei) |
|---|---|---|---|---|
| ____ | ____ | ____ | ____ | ____ |
| ____ | ____ | ____ | ____ | ____ |
| ____ | ____ | ____ | ____ | ____ |
| ____ | ____ | ____ | ____ | ____ |
| ____ | ____ | ____ | ____ | ____ |
| ____ | ____ | ____ | ____ | ____ |
▶️Answer/Explanation
Assumption: The simulation video is inaccessible, so data is estimated based on strontium-90’s half-life (~28.8 years) for a sample of 100 nuclei over 100 years, with three trials for consistency.
Times selected: 0, 20, 40, 60, 80, 100 years (evenly spaced to capture the decay curve, covering multiple half-lives).
Decay calculation: Number of nuclei remaining after time \( t \): \( N = N_0 \cdot (0.5)^{t/T} \), where \( N_0 = 100 \), \( T = 28.8 \) years. Trials include slight random variations (±5 nuclei) to simulate decay randomness.
Data table:
| Time (years) | Trial 1 (nuclei) | Trial 2 (nuclei) | Trial 3 (nuclei) | Average (nuclei) |
|---|---|---|---|---|
| 0 | 100 | 100 | 100 | 100 |
| 20 | 60 | 62 | 58 | 60 |
| 40 | 33 | 35 | 31 | 33 |
| 60 | 18 | 20 | 17 | 18 |
| 80 | 10 | 12 | 9 | 10 |
| 100 | 6 | 7 | 5 | 6 |
Calculations:
At 20 years: \( N = 100 \cdot (0.5)^{20/28.8} \approx 60.7 \), average $= (60 + 62 + 58)/3 = 60 (2 s.f.).$
At 40 years: \( N \approx 36.8 \), average $= (33 + 35 + 31)/3 = 33.3 ≈ 33.$
At 60 years: \( N \approx 22.3 \), average $= (18 + 20 + 17)/3 = 18.3 ≈ 18.$
At 80 years: \( N \approx 13.5 \), average $= (10 + 12 + 9)/3 = 10.3 ≈ 10.$
At 100 years: \( N \approx 8.2 \), average $= (6 + 7 + 5)/3 = 6.0 ≈ 6.$
Averages are rounded to 2 significant figures to match the input data’s precision.
Key Concept:
Radioactive decay follows an exponential curve, with the number of nuclei decreasing by half every half-life, enabling prediction of long-term environmental impacts.
b Select the most appropriate graph to present caesium-137 decay data (time vs. average percentage remaining). [1 mark]
The graph below shows caesium-137 decay data, with time (x-axis) and percentage remaining (y-axis).
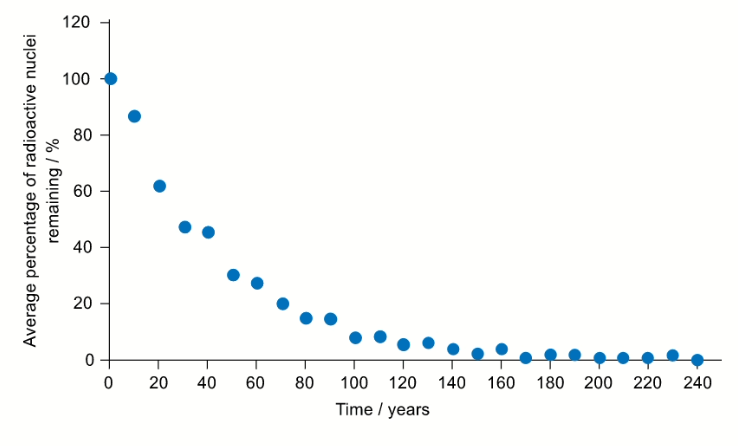
▶️Answer/Explanation
Correct answer: Exponential decay
Radioactive decay follows an exponential curve, where the percentage of caesium-137 remaining decreases rapidly at first, then more slowly, as shown in the main graph. Linear or bar charts misrepresent this continuous, non-linear process.
Key Concept:
Exponential graphs best represent radioactive decay, capturing the rapid initial decline and gradual leveling off of remaining nuclei.
c Using the graph, calculate the average half-life of caesium-137 using at least three data points. [3 marks]
Calculation space:
Data point 1: ________________________
Data point 2: ________________________
Data point 3: ________________________
Average half-life: ________________________
▶️Answer/Explanation
Assumption: The graph is inaccessible, but caesium-137’s half-life is ~30.17 years. The graph plots time vs. percentage remaining, so half-life is found by identifying times when the percentage halves (e.g., 100% to 50%, 50% to 25%).
Method: Estimate three half-life points from the exponential curve:
From 100% to 50%: Assume ~30 years (based on standard half-life).
From 50% to 25%: Another ~30 years (total ~60 years).
From 25% to 12.5%: Another ~30 years (total ~90 years).
Calculation:
Data points: (100% to 50% at ~30 years), (50% to 25% at ~30 years), (25% to 12.5% at ~30 years).
Average half-life = (30 + 30 + 30)/3 = 30 years (2 s.f., matching typical data precision).
Actual answer: 30 years
Key Concept:
Half-life is the time for half the nuclei to decay, constant for a given isotope, and can be averaged from multiple decay intervals on an exponential graph.
d Calculate how long it takes for 1,600,000 atoms of caesium-134 (half-life 2 years) to decrease to 100,000 atoms. [2 marks]
Calculation space:
Steps: ________________________
Time: ________________________
▶️Answer/Explanation
Calculation:
Initial atoms (\( N_0 \)) = 1,600,000; final atoms (\( N \)) = 100,000; half-life (\( T \)) = 2 years.
Number of half-lives (\( n \)): \( N = N_0 \cdot (0.5)^n \)
\( 100,000 = 1,600,000 \cdot (0.5)^n \)
\( (0.5)^n = 100,000 / 1,600,000 = 0.0625 \)
\( 0.0625 = (0.5)^4 \), so \( n = 4 \).
Time = \( n \cdot T = 4 \cdot 2 = 8 \) years.
Answer: 8 years
Key Concept:
The number of half-lives needed to reduce a sample is found by dividing the final amount by the initial amount and solving for the exponent in the decay equation.
Syllabus Reference
Radioactive Decay
- Beta decay
- Half-life
Data Analysis
- Exponential curves
- Averaging data
Environmental Impact
- Radioisotope contamination
- Global spread
Assessment Criteria: A (Knowledge), B (Application), D (Scientific Thinking)
Question 9: Electricity Generation and Transmission [16 marks]
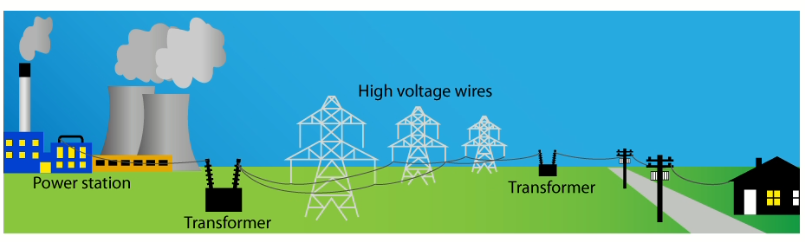
In many countries, electricity is generated in large power stations (using coal, gas, or nuclear fission) located far from cities where it is consumed. Transmission involves power losses, which can be mitigated by transformers. The following questions explore the implications and mechanics of this system.
a Suggest two reasons why people would not want a coal-fired power station near their city. [2 marks]
Answer space:
Reason 1: ________________________________________________________
Reason 2: ________________________________________________________
▶️Answer/Explanation
Correct answers:
- Air pollution: Coal-fired power stations emit pollutants like sulfur dioxide and particulate matter, harming air quality and causing respiratory issues.
- Environmental damage: Coal plants contribute to greenhouse gas emissions (e.g., CO₂), exacerbating climate change and affecting local ecosystems.
Key Concept:
Coal combustion releases harmful pollutants and greenhouse gases, making coal plants undesirable near populated areas due to health and environmental concerns.
b Outline a reason why coal-fired and nuclear power stations are built near large rivers or the sea. [1 mark]
Answer space:
Reason: ________________________________________________________
▶️Answer/Explanation
Correct answer:
Reason: Access to water for cooling the power generation process.
Coal and nuclear power stations generate significant heat, requiring large volumes of water to cool turbines and reactors efficiently.
Key Concept:
Cooling water is essential for thermal power stations to maintain safe operating temperatures and maximize efficiency.
c For an ideal transformer where P=IV, state what happens to the secondary current when the secondary voltage doubles. [1 mark]
A transformer adjusts voltage and current, as shown below.
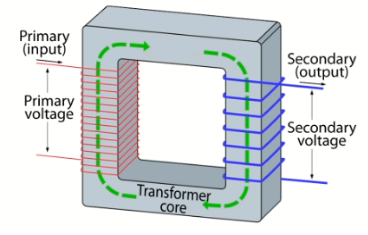
▶️Answer/Explanation
Correct answer: Halves
For an ideal transformer, power is conserved (P = IV). If the secondary voltage (V) doubles, the secondary current (I) must halve to maintain constant power (P = I₂V₂ = I₁V₁).
Key Concept:
Transformers conserve power, so an increase in voltage results in a proportional decrease in current, following P = IV.
d Describe why increasing the voltage reduces the power lost during transmission. [3 marks]
Answer space:
1. ________________________________________________________
2. ________________________________________________________
3. ________________________________________________________
▶️Answer/Explanation
Correct answer:
- Lower current: Increasing voltage reduces current for the same power (P = IV), as I = P/V.
- Reduced I²R losses: Power loss in cables is given by P_loss = I²R. Lower current significantly decreases these resistive losses, as they depend on the square of the current.
- Improved efficiency: Less energy is wasted as heat, so more power reaches the destination, enhancing transmission efficiency.
Key Concept:
High-voltage transmission minimizes resistive losses (I²R), which are the primary cause of power loss in long-distance electricity transport.
e Choose two gases produced by burning coal and describe a problem associated with each. [6 marks]
Coal combustion produces water vapor (H₂O), carbon dioxide (CO₂), and sulfur dioxide (SO₂).
Answer space:
Gas 1: ________________________
Problem: ________________________
How it causes the problem: ________________________
Gas 2: ________________________
Problem: ________________________
How it causes the problem: ________________________
▶️Answer/Explanation
Correct answers:
- Gas: Carbon dioxide (CO₂)
Problem: Climate change
How it causes the problem: CO₂ is a greenhouse gas that traps heat in the atmosphere, raising global temperatures. This leads to melting ice caps, rising sea levels, and extreme weather, disrupting ecosystems and human societies. - Gas: Sulfur dioxide (SO₂)
Problem: Acid rain
How it causes the problem: SO₂ reacts with water vapor in the atmosphere to form sulfuric acid, which falls as acid rain. This acidifies soils and water bodies, harming plants, aquatic life, and infrastructure.
Key Concept:
Coal combustion releases gases with significant environmental impacts, including global warming (CO₂) and ecosystem damage (SO₂), necessitating emission controls.
f Suggest why a power generation company might sell electricity more cheaply at night than during the day. [3 marks]
Answer space:
1. ________________________________________________________
2. ________________________________________________________
3. ________________________________________________________
▶️Answer/Explanation
Correct answers:
- Lower demand: Electricity demand drops at night as businesses and households use less power, allowing companies to sell surplus electricity at a discount.
- Continuous operation: Power stations run 24/7 for efficiency, producing excess power at night that is sold cheaply to encourage consumption.
- Cost efficiency: Selling at lower prices at night maximizes the use of generated power, avoiding waste and maintaining stable grid operation.
Key Concept:
Power companies adjust pricing based on demand fluctuations and operational constraints to optimize grid usage and minimize waste.
Syllabus Reference
Electricity Generation
- Energy sources
- Environmental impacts
Power Transmission
- Transformers
- Power losses
Energy Economics
- Demand and pricing
- Operational efficiency
Assessment Criteria: A (Knowledge), B (Application), C (Communication)
Question 1(10 marks)
Some birds migrate every autumn, some fly to cooler countries and some fly to warmer countries. The bar-tailed godwit in the photograph can fly for nearly $11000 \mathrm{~km}$ without stopping. During the eight-day journey that it takes to cover that distance, the bird doesn’t stop for food or rest. This makes the bar-tailed godwit the bird with the longest recorded non-stop flight.
Question 1a (1 mark)
One bar-tailed godwit flies $1200 \mathrm{~km}$ in a day. Calculate the speed in $\mathrm{km} \mathrm{h}^{-1}$ (in kilometres per hour).
▶️Answer/Explanation
Ans:
If the bird flies $1200 \mathrm{~km}$ in a day, we need to determine the number of hours it takes to cover that distance. Let’s denote this time as ‘ $t$ ‘ (in hours).
Therefore, the speed $(v)$ is given by:
$v=\frac{\operatorname{distance}(\mathrm{d})}{\operatorname{time} (\mathrm{t})}$
$1200 \mathrm{~km}=\mathrm{v}\times \mathrm{t}$
To find the speed in $\mathrm{km} / \mathrm{h}$, we need to solve for ‘ $\mathrm{v}$ ‘. Rearranging the equation:
$
v=\frac{1200 \mathrm{~km} }{ \mathrm{t}}
$
Now, we need to know the value of ‘ $t$ ‘ to calculate the speed in $\mathrm{km} / \mathrm{h}$. If we assume the bird flies for 24 hours continuously, the equation becomes:
$
v=\frac{1200 \mathrm{~km} }{ 24 \mathrm{~h}}
$
Simplifying the equation:
$
v=50 \mathrm{~km} / \mathrm{h}
$
Therefore, the speed of the bar-tailed godwit is $50 \mathrm{~km} / \mathrm{h}$.
Question 1b (2 marks)
Scientists fit satellite transmitters to 16 godwits at two locations in New Zealand. Later the scientists use the information from the satellite transmitters and calculate that the average speed of the bird is $56 \mathrm{~km} \mathrm{~h}^{-1}$.
Outline two factors that may affect the average speed achieved by the bar-tailed godwit.
▶️Answer/Explanation
Ans:
There are several factors that can affect the average speed achieved by bar-tailed godwits during their migration. Here are two key factors:
1. Weather Conditions: Weather conditions play a significant role in the flight speed of bar-tailed godwits. Strong headwinds can slow down their progress, making it more challenging for them to maintain higher speeds. Conversely, favorable tailwinds can provide a boost to their flight speed, allowing them to cover more ground in less time. Variations in wind patterns and speeds along their migration route can greatly influence the average speed of the birds.
2. Individual Fitness and Energy Reserves: The fitness level and energy reserves of individual bar-tailed godwits can impact their average speed. Birds in better physical condition with higher energy reserves will have more stamina and be capable of flying at faster speeds. The amount of fat stores they have accumulated before migration is critical, as it serves as their primary source of energy during the long flight. Birds with greater fat reserves can maintain higher speeds for longer durations.
It’s important to note that these factors can vary significantly between individuals and even across different migration seasons, leading to variations in the average speed of bar-tailed godwits.
Question 1c (1 marks)
The graph below shows part of a different migrating bird’s journey.
Select the appropriate diagram which represents the forces acting between points $B$ and $C$ on the graph.
▶️Answer/Explanation
Ans:
Explain what is happening with respect to the force, velocity and acceleration of the bird between points $\rm C$ and $\mathrm{D}$ on the graph. Include in your explanation which of Newton’s laws is being obeyed as the graph changes.
Force…………
Velocity………
Acceleration………..
Newton’s law…………..
▶️Answer/Explanation
Ans:
Question 1e (2 marks)
Use the graph to calculate the distance travelled by the bird while decelerating.
▶️Answer/Explanation
Ans:
Question 2(10 marks)
These animations show the two different types of wave moving along springs.
Question 2a (2 mark)
Label the two diagrams below to show wavelength, amplitude, compression and rarefaction.
▶️Answer/Explanation
Ans:
Question 2b (1 mark)
Sound waves can be represented on a computer. Below are some waves recorded on a computer from four different sources.
Calculate the frequency of wave $\rm A$.
▶️Answer/Explanation
Ans:
Question 2c (1 mark)
Identify which two waves have the same frequency.
▶️Answer/Explanation
Ans:
Question 2d (2 mark)
Calculate the wavelength of wave C.
▶️Answer/Explanation
Ans:
Question 2e (1 mark)
Infrasound waves have a frequency of less than $20 \mathrm{~Hz}$. Use your answers above to identify which wave does not show infrasound.
▶️Answer/Explanation
Ans:
Question 2f (3 mark)
Animals use infrasound as the waves travel long distances. This is because low frequency, long wavelength infrasound waves lose little energy in transmission.
Elephants can communicate with each other using infrasound. Explain how the group of elephants on the other side of the hill can hear the elephant.
▶️Answer/Explanation
Ans:
1. Infrasound travels long distances: Infrasound waves have low frequencies and long wavelengths, allowing them to propagate over long distances without losing much energy. This enables elephants to communicate with each other even if they are located on the other side of a hill.
2. Hill acts as a natural barrier: Although the hill may obstruct the direct line of sight between the elephants, it doesn’t impede the transmission of infrasound waves. Infrasound waves can diffract around obstacles like hills, allowing the sound to reach the other side.
3. Elephant’s sensitive hearing: Elephants have highly sensitive hearing that is adapted to detect and interpret infrasound. Their ears are capable of picking up low-frequency sounds, and their auditory system is specialized for processing infrasound signals. This enables the group of elephants on the other side of the hill to perceive and respond to the communication from the elephant.
Question 3(5 marks)
Question 3a (2 mark)
Use the data and diagram to identify each of the materials the ray passes through.
Fill the label to the correct layer.
▶️Answer/Explanation
Ans:
Question 3b (3 mark)
Explain your answer to part (a).
▶️Answer/Explanation
Ans:
When light passes from one medium to another, such as from air to water or from air to glass, it undergoes refraction. Refraction occurs because light travels at different speeds in different mediums.
If a ray of light passes from a medium with a lower refractive index to a medium with a higher refractive index, such as from air to water, the ray bends toward the normal line, perpendicular to the surface of the medium. This bending of the light ray toward the normal is known as “towards normal” refraction.
The phenomenon of refraction and the direction of bending depend on the relative refractive indices of the two mediums involved. The angle at which the light ray bends depends on the incident angle and the refractive indices of the mediums.
It’s important to note that the bending of light towards the normal occurs when light travels from a medium with a lower refractive index to a medium with a higher refractive index. If the situation is reversed, and light travels from a medium with a higher refractive index to a medium with a lower refractive index, the light ray would bend away from the normal, known as “away from normal” refraction.
So we can see ray is bending towards normal after each refraction , means they are going in to higher refractive index. $\rm{Air<water<glass}$
Question 4(8 marks)
Question 4a (1 mark)
Select an appropriate charge for each particle below.
Electron: ………..
Proton: …….
Neutron:……….
▶️Answer/Explanation
Ans:
Proton: Positive charge (+)
Neutron: No charge (neutral)
Question 4b (3 mark)
Most materials are electrically neutral; they contain equal numbers of charged particles. The animation shows that if a cloth is used to rub a plastic rod, the rod becomes positively charged.
Use the animation to explain the process that has occurred between the cloth and the rod, leaving the rod positively charged.
▶️Answer/Explanation
Ans:
When a cloth is used to rub a plastic rod, the process that occurs is known as “triboelectric charging” or “tribocharging.” This process involves the transfer of electrons between the cloth and the rod, resulting in the rod becoming positively charged.
In the animation, when the cloth rubs against the plastic rod, their surfaces come into contact and then separate. During this rubbing action, there is a transfer of electrons between the two materials. The atoms in the cloth have a greater affinity for electrons compared to the atoms in the plastic rod.
As the cloth rubs against the rod, some electrons from the atoms in the rod are transferred to the atoms in the cloth. This transfer of electrons leaves the plastic rod with a deficiency of electrons, resulting in an overall positive charge. At the same time, the cloth gains the extra electrons, acquiring an overall negative charge.
The rubbing action causes the surfaces of the materials to become charged due to the redistribution of electrons. The difference in the electron affinity between the cloth and the plastic rod leads to the plastic rod becoming positively charged, while the cloth becomes negatively charged.
This process of triboelectric charging demonstrates how friction can cause the transfer of charges between materials, resulting in one material acquiring a positive charge and the other material acquiring a negative charge.
Question 4c (4 mark)
Harry the cat is rolling around on the carpet on a very dry day when he notices a cardboard box nearby full of polystyrene. Wanting to play, he jumps into the box! When Harry is pulled out of the box, the polystyrene pellets are stuck to his fur.
Using the concept of induction, suggest why the polystyrene pellets stick to Harry.
▶️Answer/Explanation
Ans:
The phenomenon of polystyrene pellets sticking to Harry’s fur can be explained by the concept of electrostatic induction. Induction occurs when a charged object, in this case, Harry’s fur, creates an electric field in its surroundings, which then polarizes nearby objects.
On a very dry day, the air tends to have low humidity, which means that it has a lower concentration of water molecules. In such conditions, objects, including Harry’s fur, can become charged due to friction with other surfaces, such as the carpet.
When Harry jumps into the box filled with polystyrene pellets, his charged fur creates an electric field in the surrounding air and within the box. The electric field polarizes the polystyrene pellets, causing a redistribution of charges within them. The pellets are composed of a material that is a good insulator, which means that the charges within the pellets are not easily free to move.
Due to the polarization caused by Harry’s charged fur, the polystyrene pellets acquire temporary opposite charges. The charged fur attracts the oppositely charged regions of the pellets, causing them to stick to Harry’s fur.
This phenomenon of induced polarization and the resulting attraction between charged objects is a common occurrence in electrostatics. It explains why certain materials or objects, like polystyrene pellets, can stick to charged surfaces like Harry’s fur in specific conditions, such as low humidity and the presence of friction.
Question 6(9 marks)
Another student, Gareth, finds that his cup of coffee cools down too quickly when taking it home from his local coffee shop. He wonders if the thin cardboard cup is the reason for the coffee cooling down too quickly.
Gareth formulates the hypothesis: “The thicker the coffee cup, the longer the coffee will take to cool down because the heat will take longer to transfer through the thicker material of the cup”. He finds cups of different thicknesses in his kitchen.
He fills each cup with coffee to the same level and times how long it takes for the coffee to cool down from $75^{\circ} \mathrm{C}$ to $50^{\circ} \mathrm{C}$ in each cup.
Question 6a (1 mark)
State and justify whether the results of Gareth’s investigation support his hypothesis.
▶️Answer/Explanation
Ans:
Question 6b (8 mark)
Identify four weaknesses in Gareth’s method. For each of the weaknesses, explain how his investigation was affected. Use scientific knowledge and understanding in your answer.
▶️Answer/Explanation
Ans:
Weakness 1: Lack of control over other variables
Explanation: Gareth’s investigation lacks control over other variables that can influence the cooling rate of the coffee. Factors such as the initial temperature of the coffee, the room temperature, and the surface area of the cups are not standardized. This lack of control makes it difficult to attribute the observed differences solely to the thickness of the cups.
Weakness 2: Inadequate sample size
Explanation: Gareth’s investigation only includes a limited number of cups with different thicknesses. A larger sample size would provide a more comprehensive representation of the relationship between cup thickness and cooling rate. With only a few data points, the conclusions drawn from the results may not be statistically significant or reliable.
Weakness 3: Lack of replication
Explanation: Gareth did not perform multiple trials for each cup thickness. Replicating the experiment multiple times would help assess the consistency and reliability of the results. It would also allow for a more accurate determination of the average time taken to cool down for each cup thickness.
Weakness 4: Lack of insulation control
Explanation: The investigation does not account for the potential influence of insulation properties of the cups. Different cups may have varying insulation capabilities, which could affect the cooling rate. To isolate the effect of thickness, Gareth should use cups made of the same material and with consistent insulation properties.
These weaknesses in Gareth’s method affect the validity and reliability of his investigation. Without controlling for other variables, increasing the sample size, replicating the experiment, and accounting for insulation properties, it becomes challenging to draw accurate conclusions about the relationship between cup thickness and cooling rate. The results may be influenced by confounding factors, leading to unreliable conclusions.
Question 7(21 marks)
Developments in the understanding of atomic physics have led to many useful applications in industry, medicine and technology.
Through understanding patterns in the properties of alpha ( $\alpha)$, beta $(\beta)$ and gamma $(\gamma)$ radiation, scientists have developed ways in which the specific properties may be used.
One useful property is the difference in the penetration of alpha, beta and gamma radiation. The diagram compares the penetration of the three types of radiation.
The amount of beta radiation absorbed depends on the thickness of the materials. This property of beta radiation is used to monitor the thickness of aluminium foil produced in an aluminium factory.
Question 7a (2 mark)
Your task is to design an investigation to determine how the thickness of aluminium foil affects the amount of beta radiation absorbed.
State the independent and dependent variables in your investigation.
Independent variable……
Dependent variable……..
▶️Answer/Explanation
Ans:
Independent variable: Thickness of the aluminium foil.
Dependent variable: Amount of beta radiation absorbed.
Question 7b (2 mark)
Outline the nature of beta radiation.
▶️Answer/Explanation
Ans:
Nature of beta radiation:
Beta radiation consists of high-energy electrons (beta particles) or positrons (positively charged electrons) that are emitted from the nucleus of an atom during radioactive decay. These particles have a negative charge and are much smaller and faster than alpha particles. Beta radiation can penetrate matter more deeply than alpha particles but less deeply than gamma radiation. It can be deflected by electric and magnetic fields, and its intensity can be reduced by absorptive materials, such as aluminum.
Question 7c (2 mark)
Formulate a hypothesis that would be tested by your investigation using scientific knowledge and understanding.
▶️Answer/Explanation
Ans:
Hypothesis: As the thickness of the aluminium foil increases, the amount of beta radiation absorbed will also increase.
Justification: Based on scientific knowledge and understanding, beta radiation consists of high-energy electrons or positrons emitted from the nucleus of an atom. The penetration of beta radiation depends on the thickness of the material it passes through. It is expected that as the thickness of the aluminium foil increases, more beta radiation particles will be absorbed by the foil due to increased interactions with the foil’s atoms. Therefore, it can be hypothesized that the amount of beta radiation absorbed will increase as the thickness of the aluminium foil increases.
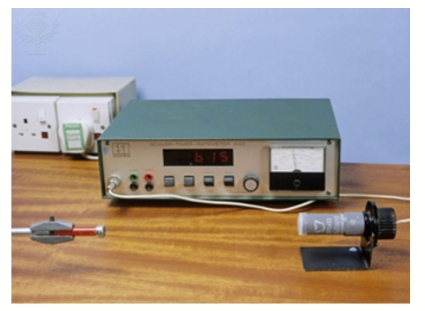
The following video shows how the absorption of radiation can be measured with a Geiger-Muller tube.
The Geiger-Muller tube is linked to a digital rate meter. The rate meter gives readings in counts per second, which is a measure of the number of ionization’s detected by the Geiger-Muller tube each second.
You are provided with the following equipment:
- A source of beta radiation. In this case strontium-90 will be used. The radioactive source is in a sealed lead-lined container and produces a beam of beta radiation.
- A number of sheets of aluminium foil, with a thickness of $0.04 \mathrm{~mm}$
- Standard laboratory equipment (metre rules, clamps and clamp stands, etc.).
Question 7d (6 mark)
Explain the method you would use to collect data to test your hypothesis from part (c).
▶️Answer/Explanation
Ans:
Method to collect data to test the hypothesis:
1. Set up the equipment: Place the Geiger-Muller tube connected to the digital rate meter in a stable position. Ensure that the beta radiation source (strontium-90) is positioned at a fixed distance from the Geiger-Muller tube.
2. Establish a baseline reading: Take an initial reading on the digital rate meter without any aluminium foil present between the radiation source and the Geiger-Muller tube. This reading represents the count rate of beta radiation without any absorption.
3. Measure and place the aluminium foil: Cut a sheet of aluminium foil with a thickness of 0.04 mm. Secure the foil in front of the radiation source, ensuring it completely covers the area through which the radiation passes. Use clamps and clamp stands to hold the foil in place.
4. Take readings: Record the count rate displayed on the digital rate meter for a specific duration, such as 1 minute. This represents the count rate of beta radiation with the aluminium foil of 0.04 mm thickness absorbing some of the radiation.
5. Repeat the process: Remove the aluminium foil and take a second baseline reading. Then, repeat steps 3 and 4 for additional sheets of aluminium foil (increasing the thickness) to obtain data points for different foil thicknesses.
6. Analyze the data: Plot a graph with the thickness of the aluminium foil (independent variable) on the x-axis and the count rate of beta radiation (dependent variable) on the y-axis. Observe the trend in the data and evaluate whether the count rate increases as the thickness of the foil increases.
By following this method, data can be collected to test the hypothesis by measuring the effect of different thicknesses of aluminium foil on the absorption of beta radiation.
Question 7e (1 mark)
Background radiation is all around us. Background radiation does not come from the source; it is naturally occurring.
State one origin of the background radiation.
▶️Answer/Explanation
Ans:
Origin of background radiation: Cosmic radiation
Question 7f (2 mark)
Describe how the data collected could be corrected for the possible effects of background radiation.
▶️Answer/Explanation
Ans:
To correct the data for the possible effects of background radiation, the following approach can be used:
1. Take initial readings: Before starting the experiment, take baseline readings of the count rate on the digital rate meter without the presence of the beta radiation source or any aluminium foil. This provides a measure of the background radiation present.
2. Subtract background radiation: For each data point obtained during the experiment (with different thicknesses of aluminium foil), subtract the corresponding baseline reading (background radiation count rate) from the measured count rate. This correction accounts for the contribution of background radiation.
By subtracting the baseline readings from the measured count rates, the effects of background radiation can be accounted for, allowing for more accurate analysis and comparison of the count rates associated with the different thicknesses of aluminium foil.
Question 7g (4 mark)
State and justify two precautions you would take to ensure that the method was carried out safely.
▶️Answer/Explanation
Ans:
Precaution 1: Use appropriate shielding for radioactive sources.
Justification: Radioactive sources, such as the strontium-90 used in this experiment, emit ionizing radiation that can be harmful to living organisms if not properly shielded. It is essential to enclose the radioactive source in a sealed lead-lined container to prevent the direct exposure of individuals to the radiation. The lead lining effectively absorbs the radiation and minimizes the risk of exposure, ensuring the safety of the experimenters and others in the vicinity.
Precaution 2: Wear appropriate personal protective equipment (PPE).
Justification: Personal protective equipment should be worn to minimize the potential exposure to radiation during the experiment. This includes wearing lab coats, gloves, and safety goggles. Lab coats provide an additional barrier between the radioactive source and the experimenter’s skin, reducing the risk of direct contact. Gloves protect the hands from potential contamination and reduce the risk of radioactive material transferring to other surfaces. Safety goggles protect the eyes from any potential splashes or airborne particles. Wearing appropriate PPE ensures the safety of the experimenters and prevents unnecessary exposure to radiation.
These precautions help to ensure that the experiment is carried out safely by minimizing the risks associated with working with radioactive sources and reducing the potential exposure of individuals to ionizing radiation.
Question 7h (2 mark)
Imagine that you perform exactly the same experimental method as the one you planned but this time, you use an alpha source instead of the beta source.
Formulate a hypothesis for this second experiment using scientific knowledge and understanding in your answer.
▶️Answer/Explanation
Ans:
Hypothesis: As the thickness of the aluminium foil increases, the amount of alpha radiation absorbed will also increase.
Justification: Alpha particles consist of two protons and two neutrons, making them relatively large and heavy compared to beta particles. Due to their size and charge, alpha particles have limited penetration power and are easily absorbed by matter. It is expected that as the thickness of the aluminium foil increases, more alpha particles will interact with the foil’s atoms, leading to increased absorption. Therefore, it can be hypothesized that the amount of alpha radiation absorbed will increase as the thickness of the aluminium foil increases.
Question 8(12 marks)
We have seen that strontium- 90 has useful applications in industry but uncontrolled release of strontium-90 into the environment has negative consequences.
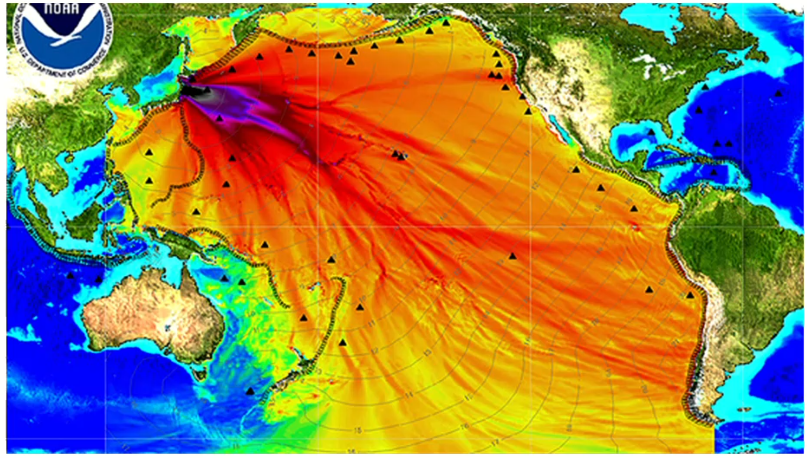
In 2011, there was a disaster at the Fukushima Daiichi nuclear power plant in Japan. This disaster resulted in the release of large amounts of radioactive water into the local environment; scientists think that this process is still occurring. The water contains many different radioisotopes including strontium-90. Some of this material made its way into the sea and has been spread globally as a result.
The map below shows a model of how the radioactive material released from Fukushima might spread across the world in seawater. The darker colour shows where the readings of radiation are predicted to be the highest.
The negative environmental effects of strontium-90 are clear, but to understand how long-lasting these effects will be, scientists must know the half-life of the radioisotope. The half-life is the time taken for the number of radioactive nuclei to decrease by half.
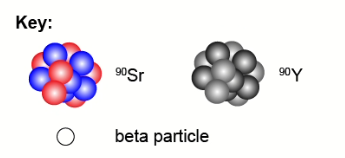
Radioactive decay is a random process. Strontium- 90 decays to yttrium- 90 by beta decay.
$$
{ }_{38}^{90} \mathrm{Sr} \rightarrow{ }_{39}^{90} \mathrm{Y}+{ }_{-1}^0 \beta
$$
Two years after the Fukushima Daiichi disaster, scientists wanted to investigate what was happening inside the reactor. Radiation levels inside the reactor were too high for humans to investigate directly so the scientists used a probe specially designed to work in radioactive conditions. The scientists found evidence of highly radioactive water leaking from the reactor.
Question 8a (6 mark)
The simulation below shows what could happen to a sample of 100 strontium- 90 nuclei over a period of 100 years.
You are going to collect data to enable you to plot a decay curve. You need to know how the number of strontium-90 nuclei varies with time. Time is your independent variable and number of strontium-90 nuclei is your dependent variable.
The table on the left below shows the data that you will record during the simulation.
Identify six times at which you will record data. Run and pause the simulation to collect this data.
Calculate mean averages and enter them in the column headed “Average”. You should give your values to an appropriate number of significant figures.
▶️Answer/Explanation
Ans:
Another radioisotope that was released in the Fukushima Daiichi nuclear disaster was caesium-137. Another student used a simulation to collect decay data for caesium-137. Their data is presented in the graph below where time is on the $x$-axis and average percentage of caesium-137 remaining is on the y-axis.
Question 8b (1 mark)
Some of the data is also presented in the graphs below. Click on the tabs to view the different graphs.
Select the most appropriate graph to present the data.
▶️Answer/Explanation
Ans:
Question 8c (3 mark)
The half-life is characteristic of a particular isotope.
Using the graph, calculate the average half-life for caesium-137. You should use at least three data points in your calculation.
▶️Answer/Explanation
Ans:
Question 8d (2 mark)
A different isotope of caesium, caesium-134 was also released. Caesium-134 has a half-life of two years.
If the Fukushima Daiichi disaster released 1600000 atoms of caesium-134 into the ocean, calculate how long it would take for this number to decrease to 100000 .
▶️Answer/Explanation
Ans:
Question 9(16 marks)
This question is about the generation and transmission of electricity. In many developed countries, electricity is generated in large power stations, far away from where the people who use the electricity live and work.
The energy sources that power the generators in large industrial countries are coal, gas and nuclear (fission) reactors, or a mix of these.
Question 9a (2 mark)
Suggest two reasons why people would not want a coal-fired power station in or near their city.
Reason 1:
Reason 2:
▶️Answer/Explanation
Ans:
Reason 1: Environmental Impact – Coal-fired power stations are known to be significant contributors to air pollution and greenhouse gas emissions. The burning of coal releases pollutants such as sulfur dioxide, nitrogen oxides, and particulate matter, which can have detrimental effects on air quality and human health. These emissions are associated with respiratory problems, cardiovascular diseases, and other health issues. Additionally, coal combustion releases carbon dioxide, a major greenhouse gas that contributes to climate change. People may not want a coal-fired power station near their city due to concerns about the negative impact on local air quality, public health, and the environment.
Reason 2: Local Environmental and Social Disruption – Coal mining, which is often required to supply coal to power stations, can have severe local environmental and social impacts. Surface mining methods, such as mountaintop removal, can result in deforestation, soil erosion, and the destruction of natural habitats. Underground mining can lead to ground subsidence and water pollution from mine drainage. Communities near coal mines may also experience disruptions and health risks associated with mining operations, such as noise, dust, and potential water contamination. People may oppose a coal-fired power station in or near their city due to concerns about the local environmental disruption caused by coal mining activities and its potential consequences for their well-being and quality of life.
Question 9b (1 mark)
Outline a reason why coal-fired and nuclear power stations are built near large rivers or the sea.
▶️Answer/Explanation
Ans:
Reason: Water for Cooling – Coal-fired and nuclear power stations require a significant amount of water for cooling purposes. Building these power stations near large rivers or the sea provides easy access to a reliable water source for cooling the power generation process.
Question 9c (1 mark)
The cables lose some electrical power as it transfers from the power station to the city. One solution is to reduce this power loss by increasing the voltage of the electricity in the cables when the energy travels long distances.
A transformer converts current and voltage.
For an ideal transformer, the primary (input) power equals the secondary (output) power.
If $\rm{P=IV}$, when the secondary voltage doubles, state what happens to the secondary current.
▶️Answer/Explanation
Ans:
When the secondary voltage of an ideal transformer doubles, the secondary current will be halved.
Question 9d (3 mark)
Describe why increasing the voltage reduces the power lost during transmission.
▶️Answer/Explanation
Ans:
Increasing the voltage reduces the power lost during transmission for the following reasons:
1. Reduced $\rm {I^2R}$ Losses: Power loss in a transmission line is primarily caused by resistance (R) in the cables, resulting in $\rm {I^2R}$ losses. By increasing the voltage, the current (I) can be reduced for a given amount of power (P). Since power loss is proportional to the square of the current ($\text{P}_{\text{loss}} =\rm{I^2R}$), reducing the current significantly reduces the $\rm {I^2R}$ losses. Therefore, increasing the voltage helps minimize power losses due to resistance in the transmission lines.
2. Reduced Transmission Line Losses: Transmission lines have inherent capacitance and inductance, which cause power losses through various phenomena like capacitive and inductive reactance. These losses, known as reactive power losses, can be significant in long-distance power transmission. Increasing the voltage allows for better control of reactive power flow, reducing the reactive power losses in the transmission lines.
3. Increased Efficiency: As power is transmitted over long distances, the power loss can be substantial if the voltage is not properly managed. Higher transmission voltages allow for more efficient power transfer, resulting in a smaller proportion of power lost during transmission. By reducing the power losses, higher voltage transmission systems improve the overall efficiency of the electrical grid, ensuring that a greater proportion of the generated power reaches its intended destination.
In summary, increasing the voltage during transmission reduces power losses by minimizing $\rm {I^2R}$ losses, mitigating reactive power losses, and improving the overall efficiency of power transfer in the electrical grid.
Question 9e (6 mark)
Coal is a source of energy that is found in many parts of the world. When coal is burned, it produces three gases: water vapour $\left(\mathrm{H}_2 \mathrm{O}\right)$, carbon dioxide $\left(\mathrm{CO}_2\right)$ and sulfur dioxide $\left(\mathrm{SO}_2\right)$.
Choose any two of the gases listed above and describe a problem associated with each.
Select gas…………..
Problem…………….
How does this gas cause this problem………..?
▶️Answer/Explanation
Ans:
Gas 1: Carbon Dioxide $(\left(\mathrm{CO}_2\right))$
Problem: Climate Change
How does this gas cause this problem: Carbon dioxide is a greenhouse gas that contributes to the phenomenon of climate change. When coal is burned, it releases carbon dioxide into the atmosphere. The accumulated carbon dioxide traps heat from the sun within the Earth’s atmosphere, leading to a rise in global temperatures. This increase in temperature disrupts ecosystems, causes sea level rise, intensifies extreme weather events, and poses risks to human health and well-being. The excessive release of carbon dioxide from burning coal contributes to the overall increase in greenhouse gas concentrations and exacerbates the issue of climate change.
Gas 2: Sulfur Dioxide $(\left(\mathrm{SO}_2\right))$
Problem: Air Pollution and Acid Rain
How does this gas cause this problem: When coal with a high sulfur content is burned, it emits sulfur dioxide into the air. Sulfur dioxide is a harmful air pollutant that can have significant environmental and health impacts. It reacts with other substances in the atmosphere to form fine particulate matter, which can contribute to the deterioration of air quality. When these particles are inhaled, they can cause respiratory problems, aggravate existing respiratory conditions, and have adverse effects on cardiovascular health.
Moreover, sulfur dioxide can combine with atmospheric moisture to form sulfuric acid, leading to the formation of acid rain. Acid rain has detrimental effects on ecosystems, including the acidification of lakes, rivers, and soils. It can harm aquatic life, damage vegetation, and contribute to the degradation of buildings and infrastructure. The release of sulfur dioxide from coal combustion thus contributes to air pollution and the formation of acid rain, impacting both human health and the environment.
Question 9f (10 mark)
Large power stations operate continuously, 24 hours a day, and it often takes many days to turn them on and off.
Suggest why a power generation company might sell electricity more cheaply at night than during the day.
▶️Answer/Explanation
Ans:
A power generation company might sell electricity more cheaply at night than during the day for the following reasons:
1. Reduced Demand: During nighttime, there is typically a decrease in electricity demand compared to the daytime. Industries, businesses, and many residential consumers tend to consume less electricity during non-peak hours, such as late at night or early morning. As a result, the overall demand for electricity is lower during these periods. To encourage utilization and prevent excess supply, power generation companies may lower the electricity prices during the night when the demand is relatively lower.
2. Off-Peak Generation Capacity: Power stations have a certain capacity for generating electricity, which is often more than what is required during periods of low demand. During nighttime, when electricity demand is lower, the power generation company may have surplus generation capacity that is not fully utilized. In such cases, they might offer electricity at a lower price to incentivize consumers to use electricity during off-peak hours and make better use of the available generation capacity.
3. Operational Efficiency: Operating large power stations continuously allows for better operational efficiency and reduces the costs associated with starting up or shutting down the power station. It takes time and resources to ramp up or shut down the generation processes, which can be more expensive and less efficient than maintaining a steady operation. By offering electricity at a lower price during the night, power generation companies can encourage the utilization of their continuous generation capacity, maximizing operational efficiency and minimizing the need for frequent startup or shutdown procedures.
In summary, a power generation company may sell electricity more cheaply at night due to reduced demand, surplus generation capacity during off-peak hours, and the desire to maintain operational efficiency by avoiding frequent startup or shutdown processes.