Quartiles
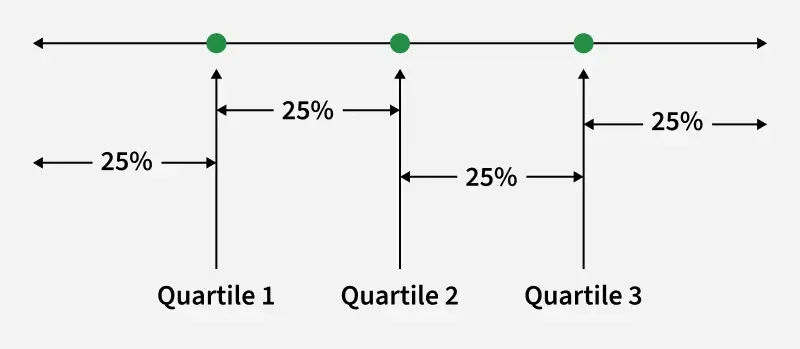
Quartiles divide a set of data into four equal parts after arranging the data in ascending order:
- Q1 (Lower Quartile): $25\%$ of the data ($\frac{1}{4}$ position).
- Q2 (Median): $50\%$ of the data (middle value).
- Q3 (Upper Quartile): $75\%$ of the data ($\frac{3}{4}$ position).
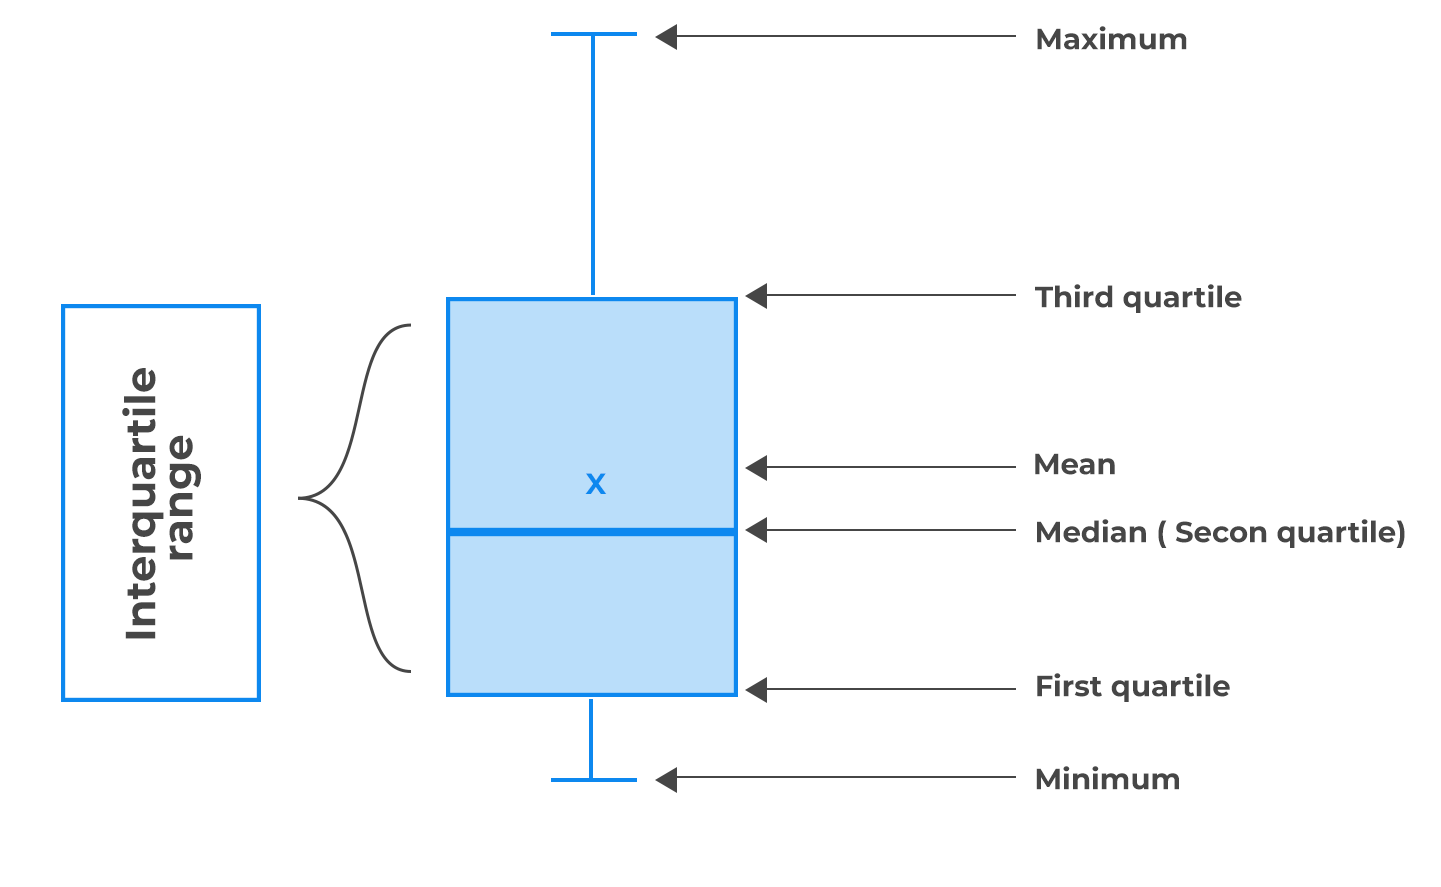
Interquartile Range (IQR): $Q3 − Q1$, measures the spread of the middle $50\%$ of data.
Steps to Calculate Quartiles:
- Arrange data in ascending order.
- Find positions:
- $Q1$ at position \( \dfrac{n+1}{4} \)
- $Q2$ at position \( \dfrac{n+1}{2} \)
- $Q3$ at position \( \dfrac{3(n+1)}{4} \)
- If the position is not an integer, interpolate between two values.
Example:
Find Q1, Q2, and Q3 for the data: 6, 8, 10, 12, 14, 18, 20.
▶️Answer/Explanation
Step 1: Data in order: 6, 8, 10, 12, 14, 18, 20 (\(n = 7\)).
Step 2: Positions:
Q1 at \( \dfrac{7+1}{4} = 2\) → 2nd value = 8
Q2 at \( \dfrac{7+1}{2} = 4\) → 4th value = 12
Q3 at \( \dfrac{3(7+1)}{4} = 6\) → 6th value = 18
Answer: Q1 = 8, Q2 = 12, Q3 = 18.
Example:
The weights (kg) of 8 students: 40, 42, 44, 46, 48, 52, 54, 60. Find Q1, Q2, and Q3.
▶️Answer/Explanation
Step 1: Data sorted: 40, 42, 44, 46, 48, 52, 54, 60 (\(n = 8\)).
Step 2: Positions:
Q1 at \( \dfrac{8+1}{4} = 2.25\) → between 2nd (42) and 3rd (44): \( Q1 = 42 + 0.25(44-42) = 42.5\)
Q2 at \( \dfrac{8+1}{2} = 4.5\) → between 4th (46) and 5th (48): \( Q2 = 46 + 0.5(48-46) = 47\)
Q3 at \( \dfrac{3(8+1)}{4} = 6.75\) → between 6th (52) and 7th (54): \( Q3 = 52 + 0.75(54-52) = 53.5\)
Answer: Q1 = 42.5, Q2 = 47, Q3 = 53.5.
Percentiles
Percentiles divide a data set into 100 equal parts. The \(k^{\text{th}}\) percentile (\(P_k\)) is the value below which \(k\%\) of the data falls.
- \(P_{25}\) = 25th percentile (same as Q1).
- \(P_{50}\) = 50th percentile (same as the median).
- \(P_{75}\) = 75th percentile (same as Q3).
Steps to Calculate Percentiles:
- Arrange the data in ascending order.
- Find position of \(P_k\): \( \text{Position} = \dfrac{k}{100} (n+1) \)
- If the position is not an integer, interpolate between values.
Example:
The test scores are: 12, 18, 20, 25, 28, 30, 35, 40, 42, 50. Find the 70th percentile (\(P_{70}\)).
▶️Answer/Explanation
Step 1: Arrange data (already sorted), \(n = 10\).
Step 2: Position = \( \dfrac{70}{100}(10+1) = 0.7 \times 11 = 7.7 \).
7th value = 35, 8th value = 40.
Interpolate: \( 35 + 0.7(40 – 35) = 35 + 3.5 = 38.5 \).
Answer: 70th percentile = 38.5.
Example:
The weights (in kg) of 12 people: 45, 48, 50, 52, 55, 57, 60, 62, 65, 68, 70, 75. Find the 90th percentile (\(P_{90}\)).
▶️Answer/Explanation
Step 1: Data is sorted, \(n = 12\).
Step 2: Position = \( \dfrac{90}{100}(12+1) = 0.9 \times 13 = 11.7 \).
11th value = 70, 12th value = 75.
Interpolate: \( 70 + 0.7(75 – 70) = 70 + 3.5 = 73.5 \).
Answer: 90th percentile = 73.5.