Lines of Best Fit
A line of best fit is a straight line drawn through a scatter plot to show the general trend of the data. It is used to make predictions and analyze relationships between variables.
Key Features:
- The line passes as close as possible to all points (not all points will lie on the line).
- Used to estimate values that are not in the original data (interpolation and extrapolation).
- The line should have roughly equal points above and below it.
Steps to Draw a Line of Best Fit:
- Plot the scatter graph for the data set.
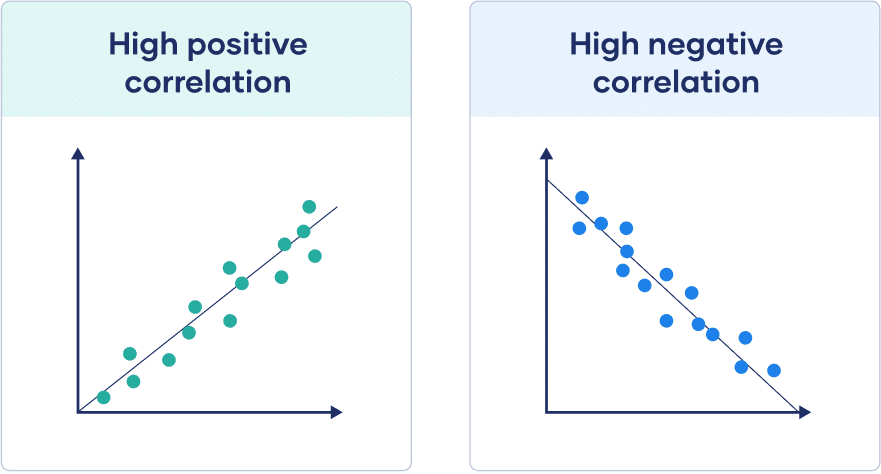
- Observe the correlation:
- Positive correlation → line slopes upward.
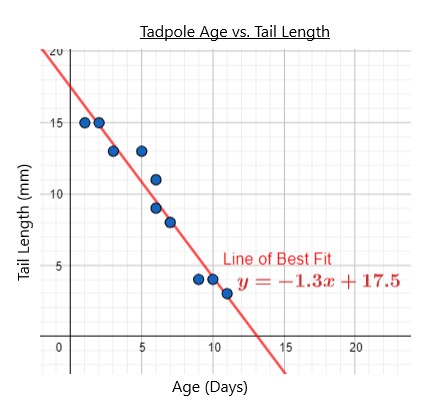
- Negative correlation → line slopes downward.

- Draw a straight line with approximately equal points on both sides.
- Use the line to predict values.
Example:
The table shows the number of study hours and test scores for 6 students:
| Hours | Score (%) |
|---|---|
| 1 | 40 |
| 2 | 48 |
| 3 | 56 |
| 4 | 63 |
| 5 | 70 |
| 6 | 78 |
Draw a line of best fit and predict the score for 7 hours of study.
▶️Answer/Explanation
Step 1: Plot points (Hours, Score) on a scatter graph.
Step 2: Draw a line of best fit through the points with equal balance on both sides.
Step 3: Extend the line to Hours = 7 and read Score ≈ 85%.
Answer: The predicted score for 7 hours is about 85%.
Example:
The table shows the outside temperature and the number of jackets sold:
| Temperature (°C) | Jackets Sold |
|---|---|
| 5 | 50 |
| 8 | 45 |
| 12 | 35 |
| 15 | 28 |
| 18 | 22 |
| 20 | 18 |
Draw the line of best fit and predict jackets sold at 10°C.
▶️Answer/Explanation
Step 1: Plot points (Temperature, Jackets sold).
Step 2: Draw the line of best fit with roughly equal points on both sides.
Step 3: At 10°C, read from the line ≈ 40 jackets.
Answer: Predicted sales at 10°C = 40 jackets.