Variance (\( \sigma^2 \) or \( s^2 \))
Variance measures the average squared deviation of each data point from the mean. It indicates how spread out the data is, but because it uses squares, its unit is different from the original data.
Why Square the Deviations?
If we just sum deviations from the mean, they cancel out (because positive and negative deviations sum to zero). Squaring removes the sign and emphasizes large deviations.
Formulas:
- Population Variance: \( \sigma^2 = \dfrac{\sum (x_i – \mu)^2}{N} \)
- Sample Variance: \( s^2 = \dfrac{\sum (x_i – \bar{x})^2}{n – 1} \)
Relation to Standard Deviation: \( \text{Standard Deviation} = \sqrt{\text{Variance}} \)
Steps to Calculate Variance:
- Find the mean (\( \bar{x} \)).
- Subtract the mean from each data point (deviation).
- Square each deviation.
Standard Deviation (SD)
Standard deviation is a measure of the spread (or dispersion) of a set of data values from the mean. It tells us how much the data values typically differ from the mean.
Importance:
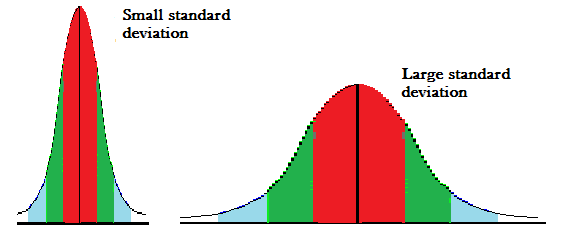
- A low SD means data points are close to the mean (less spread).
- A high SD means data points are widely spread out.
Formulas:
- Population Standard Deviation: \( \sigma = \sqrt{\dfrac{\sum (x_i – \mu)^2}{N}} \)
- Sample Standard Deviation: \( s = \sqrt{\dfrac{\sum (x_i – \bar{x})^2}{n – 1}} \)
Steps to Calculate SD:
- Find the mean (\( \bar{x} \)) of the data set.
- Subtract the mean from each data value (deviation).
- Square each deviation.
- Find the average of these squares (variance).
- Take the square root (standard deviation).
Example:
Calculate the variance for the data set: \( 2, 4, 6, 8 \).
▶️Answer/Explanation
Step 1: Find the mean: \( \bar{x} = \dfrac{2 + 4 + 6 + 8}{4} = 5 \)
Step 2: Deviations: (2-5)\(^2\)=9, (4-5)\(^2\)=1, (6-5)\(^2\)=1, (8-5)\(^2\)=9
Step 3: Sum = 20. Variance = \( \dfrac{20}{4} = 5 \)
Step 4 (Link to SD): SD = \( \sqrt{5} \approx 2.24 \)
Answer: Variance = 5, SD ≈ 2.24
Example:
The marks of 5 students are: \( 5, 7, 8, 4, 6 \). Find the variance and standard deviation.
▶️Answer/Explanation
Step 1: Mean = \( \dfrac{5+7+8+4+6}{5} = 6 \)
Step 2: Deviations squared: (5-6)\(^2\)=1, (7-6)\(^2\)=1, (8-6)\(^2\)=4, (4-6)\(^2\)=4, (6-6)\(^2\)=0
Step 3: Sum = 10. Variance = \( \dfrac{10}{5} = 2 \)
Step 4: SD = \( \sqrt{2} \approx 1.41 \)
Answer: Variance = 2, SD ≈ 1.41
Example:
Find the standard deviation of the data: \( 4, 6, 8, 10, 12 \).
▶️Answer/Explanation
Step 1: Find the mean: \( \bar{x} = \dfrac{4 + 6 + 8 + 10 + 12}{5} = 8 \)
Step 2: Deviations and squares: (4 – 8)\(^2\) = 16, (6 – 8)\(^2\) = 4, (8 – 8)\(^2\) = 0, (10 – 8)\(^2\) = 4, (12 – 8)\(^2\) = 16
Step 3: Sum = 40. Variance = \( \dfrac{40}{5} = 8 \)
Step 4: SD = \( \sqrt{8} \approx 2.83 \)
Answer: \( \approx 2.83 \)
Example:
The marks of 6 students are: \( 10, 12, 8, 10, 14, 6 \). Find the standard deviation.
▶️Answer/Explanation
Step 1: Mean = \( \dfrac{10 + 12 + 8 + 10 + 14 + 6}{6} = 10 \)
Step 2: Deviations: (10-10)\(^2\)=0, (12-10)\(^2\)=4, (8-10)\(^2\)=4, (10-10)\(^2\)=0, (14-10)\(^2\)=16, (6-10)\(^2\)=16
Step 3: Sum = 40. Variance = \( \dfrac{40}{6} \approx 6.67 \)
Step 4: SD = \( \sqrt{6.67} \approx 2.58 \)
Answer: \( \approx 2.58 \)
Important Notes:
- Variance is in squared units (e.g., if data is in cm, variance is in cm\(^2\)).
- Standard deviation brings it back to original units for better interpretation.