Representation and Shape of More Complex Functions
Functions can be represented in various forms: equations, tables, graphs, and mappings. Different functions have different shapes and properties.
1. Quadratic Functions
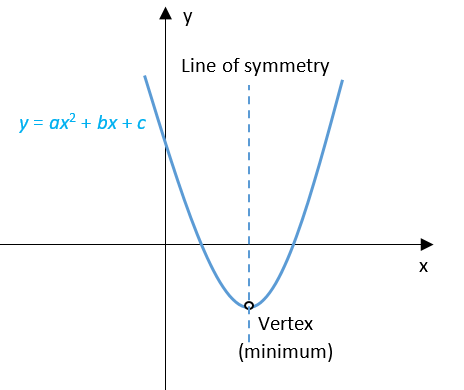
- General form: \( y = ax^2 + bx + c \), where \( a \neq 0 \).
- Graph: A parabola (U-shape).
- If \( a > 0 \), parabola opens upwards; if \( a < 0 \), opens downwards.

- Vertex: \( \left( -\frac{b}{2a}, f\left(-\frac{b}{2a}\right) \right) \).
- Axis of symmetry: \( x = -\frac{b}{2a} \).
- Domain: \( \mathbb{R} \); Range: \( y \ge \text{vertex y} \) (if \( a > 0 \)), or \( y \le \text{vertex y} \) (if \( a < 0 \)).

Example:
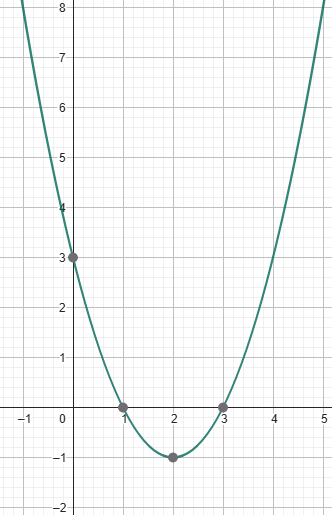
Sketch \( y = x^2 – 4x + 3 \).
▶️ Answer/Explanation
Vertex: \( x = \frac{4}{2} = 2 \), \( y = 2^2 – 4(2) + 3 = -1 \).
So vertex is (2, -1), axis of symmetry x = 2.
Find intercepts: y-intercept = 3, roots = (1, 3).
Graph: U-shape opening upwards.
2. Cubic Functions
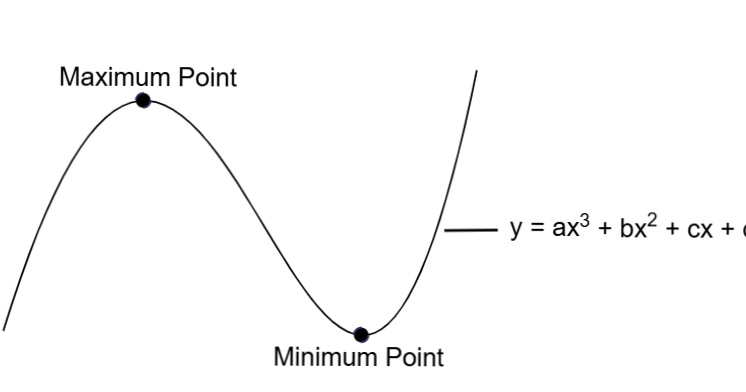
- General form: \( y = ax^3 + bx^2 + cx + d \).
- Graph: S-shaped curve, can have 1 or 2 turning points.
- If \( a > 0 \), rises to the right; if \( a < 0 \), falls to the right.
- Domain and range: \( \mathbb{R} \).
Example:
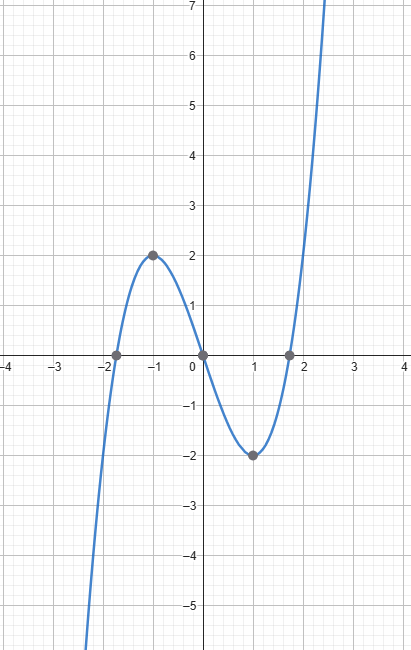
Sketch \( y = x^3 – 3x \).
▶️ Answer/Explanation
Find critical points by derivative: \( y’ = 3x^2 – 3 = 0 \) → \( x^2 = 1 \) → x = ±1.
Turning points at (-1, 2) and (1, -2).
Graph passes through origin and has S-shape.
3. Reciprocal Functions

- Form: \( y = \frac{k}{x} \), \( x \neq 0 \).
- Graph: Two branches (hyperbola) in opposite quadrants.
- Asymptotes: x = 0 (vertical), y = 0 (horizontal).
- Domain: \( x \neq 0 \); Range: \( y \neq 0 \).
Example:
Sketch \( y = \frac{6}{x} \).
▶️ Answer/Explanation
Two branches in quadrants I and III since k > 0.
Asymptotes: x = 0, y = 0.

4. Exponential Functions
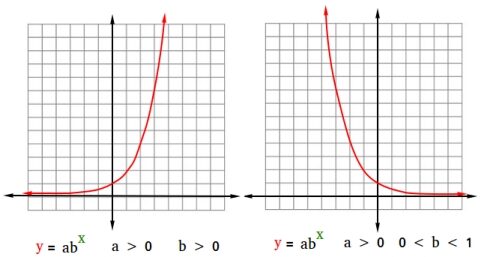
- Form: \( y = a^x \), where \( a > 0 \) and \( a \neq 1 \).
- If \( a > 1 \), function increases (growth); if \( 0 < a < 1 \), function decreases (decay).
- Domain: \( \mathbb{R} \); Range: \( y > 0 \).
- Asymptote: y = 0.
Example:
Sketch \( y = 2^x \).
▶️ Answer/Explanation
Curve passes through (0,1), increasing rapidly as x → ∞, approaches 0 as x → -∞.

5. Absolute Value Functions
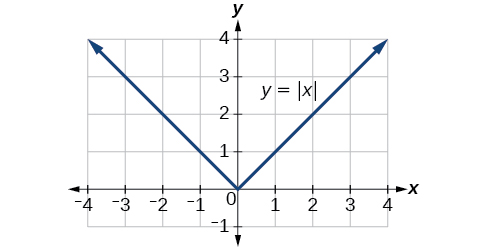
- Form: \( y = |x| \).
- Graph: V-shape with vertex at origin.
- Domain: \( \mathbb{R} \); Range: \( y \ge 0 \).
Example :
Sketch \( y = |x – 2| \).
▶️ Answer/Explanation
Vertex at (2, 0), opens upward in V-shape.

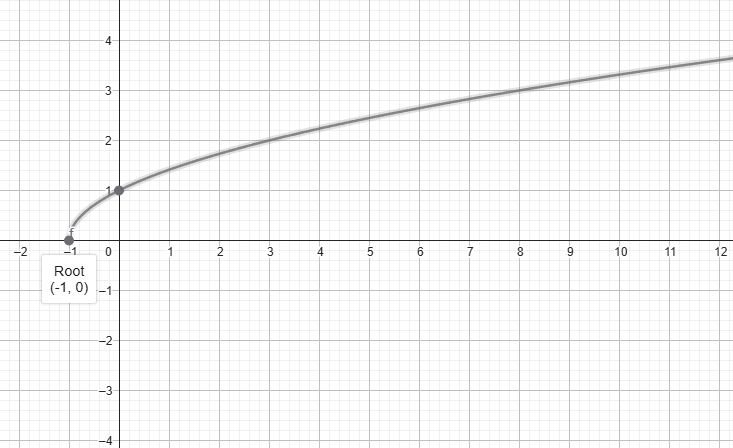
6. Square Root Functions
- Form: \( y = \sqrt{x} \).
- Graph: Starts from origin and increases slowly.
- Domain: \( x \ge 0 \); Range: \( y \ge 0 \).
Example :
Sketch \( y = \sqrt{x + 1} \).
▶️ Answer/Explanation
Graph shifts left by 1 unit, starts from (-1, 0).