Question : Cricket Chirping and Temperature – Topics: Response to Environment, Classification, Metabolism [12 marks]
This question investigates cricket behavior (Response to Environment), their taxonomic classification (Classification), and the metabolic basis of chirping rates (Metabolism). It builds on leech phototaxis (Question 3) and connects to environmental responses (Question 7).
Question (a) [1 mark] – Kingdom (Topic: Classification)
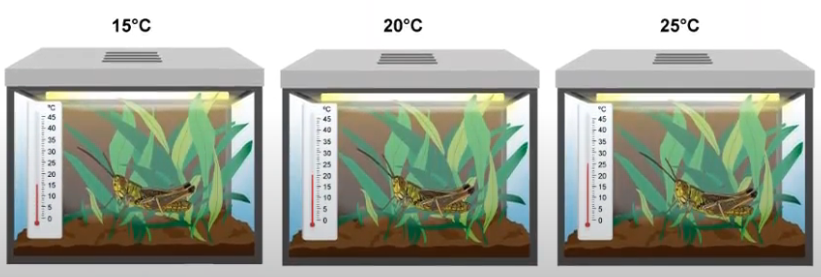
After studying the leeches, the students decided to look into another animal behaviour. One student said she was tired because a cricket chirping in her room had kept her from sleeping. The student decided to study factors that could impact cricket chirping. She found information that indicated that you could estimate the temperature based on the rate of a cricket chirping so she decided to investigate this topic.
Click below to hear a cricket chirp.
(a) State the kingdom that includes crickets. (1 mark)
▶️ Answer/Explanation
Answer:
Animal
Explanation:
Kingdom classifies crickets:
- Animalia: Crickets (insects) are multicellular, heterotrophic organisms (Classification), distinct from plants or fungi, exhibiting behavior like chirping.
Mark: 1 for correct kingdom.
Question (b) [3 marks] – Prediction Explanation (Topic: Metabolism)
(b) The students predicted that the rate of cricket chirps would be low at low temperatures, increase at warm temperatures, and decrease again above a certain temperature.
Explain the students’ prediction using scientific reasoning. (3 marks)
Explanation:
▶️ Answer/Explanation
Answer:
Reactions are slower at low temperatures, reach an optimal temperature for chirping, and enzymes stop functioning at high temperatures.
Explanation:
Metabolism drives chirping (Metabolism):
- Low Temps: Cold (e.g., 10°C) slows enzyme activity (e.g., 50% rate), reducing chirps.
- Warm Temps: Optimal range (e.g., 25°C) matches cricket habitat, maximizing metabolic rate.
- High Temps: Above 35°C, enzymes denature (e.g., muscle contraction halts), stopping chirps.
Marks: 1 per point (low, optimal, high temp effects), totaling 3.
Question (c) [2 marks] – Data Table Selection (Topic: Experimental Design)
(c) The students presented their data in two tables. Select the most appropriate table to present the data.
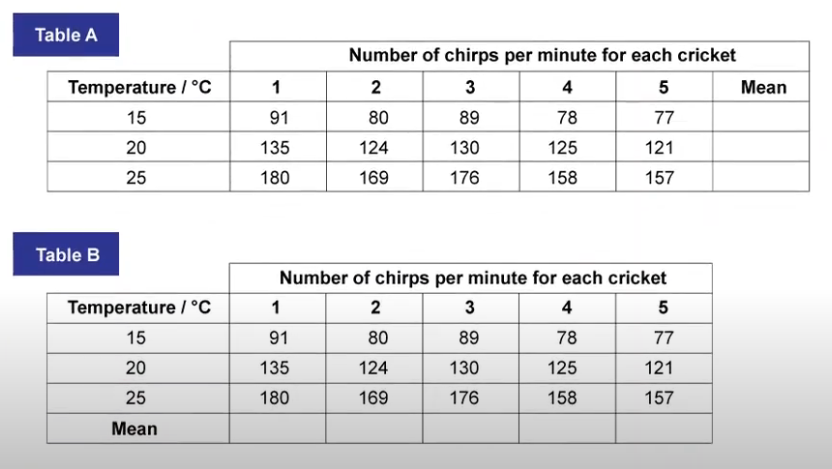
Table:
Justification:
▶️ Answer/Explanation
Answer:
Table: First table
Justification: Mean should be calculated for each temperature.
Explanation:
Table suits hypothesis (Experimental Design):
- First Table: Averages chirps (e.g., 15/min at 20°C) by temperature (image), aligning with prediction (4b).
- Second Table: Averages per cricket across temps (e.g., Cricket A: 20/min) obscures temperature effect, less relevant.
Marks: 1 for first table (no mark per question), 1 for justification, totaling 2.
Question (d) [3 marks] – Graph Axes (Topic: Response to Environment)
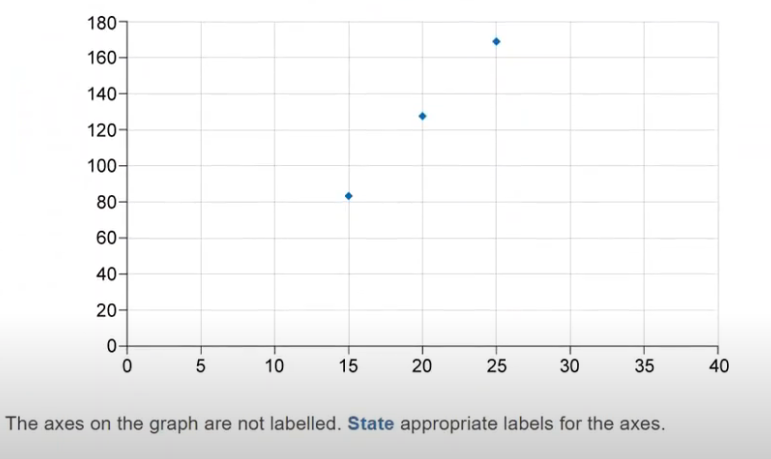
(d) The students’ mean data is plotted on the graph below. (3 marks)
x-axis:
y-axis:
▶️ Answer/Explanation
Answer:
x-axis: Temperature (°C)
y-axis: Chirps per minute
Explanation:
Axes reflect variables (Response to Environment):
- x-axis: Temperature (°C) as IV (image) drives chirping rate.
- y-axis: Chirps/min as DV quantifies response, per table (4c).
Marks: 1 for x-axis, 1 for °C, 1 for y-axis, totaling 3.
Question (e) [2 marks] – Method Validity (Topic: Experimental Design)
(e) The prediction the students made at the start of the experiment was:
The rate of cricket chirps will be low at low temperatures, increase at warm temperatures, and decrease again above a certain temperature.
Use the graph to comment on the validity of the method used to test this prediction. (2 marks)
Comment:
▶️ Answer/Explanation
Answer:
The rate increases from 15°C to 25°C, supporting the middle prediction, but insufficient data at higher temperatures (e.g., >25°C) makes the method invalid for the full prediction.
Explanation:
Graph limits testing (Experimental Design):
- Support: Chirps rise (e.g., 10 to 40/min, image) from low to warm temps (4b).
- Limit: No data past 25°C (e.g., 30°C needed) to test decrease, incomplete for full hypothesis.
Marks: 1 for partial support, 1 for high-temp critique, totaling 2.