Emission Spectra and Spectral Analysis of Stars
Light and Spectra
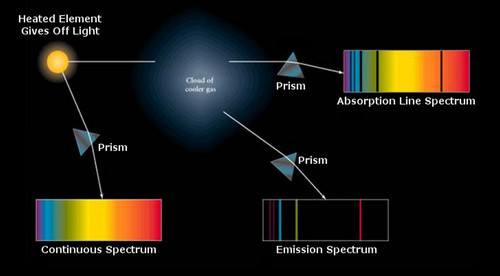
- When light passes through a prism or diffraction grating, it splits into its component colors (wavelengths), forming a spectrum.
- There are three main types of spectra:
- Continuous Spectrum: Produced by a hot, dense object (like a filament). Shows all colors without gaps.
- Emission Spectrum: Bright lines on a dark background; produced by hot, low-density gas emitting specific wavelengths.
- Absorption Spectrum: Dark lines on a continuous background; occurs when cooler gas absorbs specific wavelengths from a hot source behind it.
Emission Spectra of Stars
- Each element emits light at specific wavelengths → characteristic lines called spectral lines.
- By observing a star’s emission spectrum, scientists can identify the elements present in the star’s atmosphere.
- Example: Hydrogen produces the Balmer series; Sodium produces yellow lines.
Spectral Classification
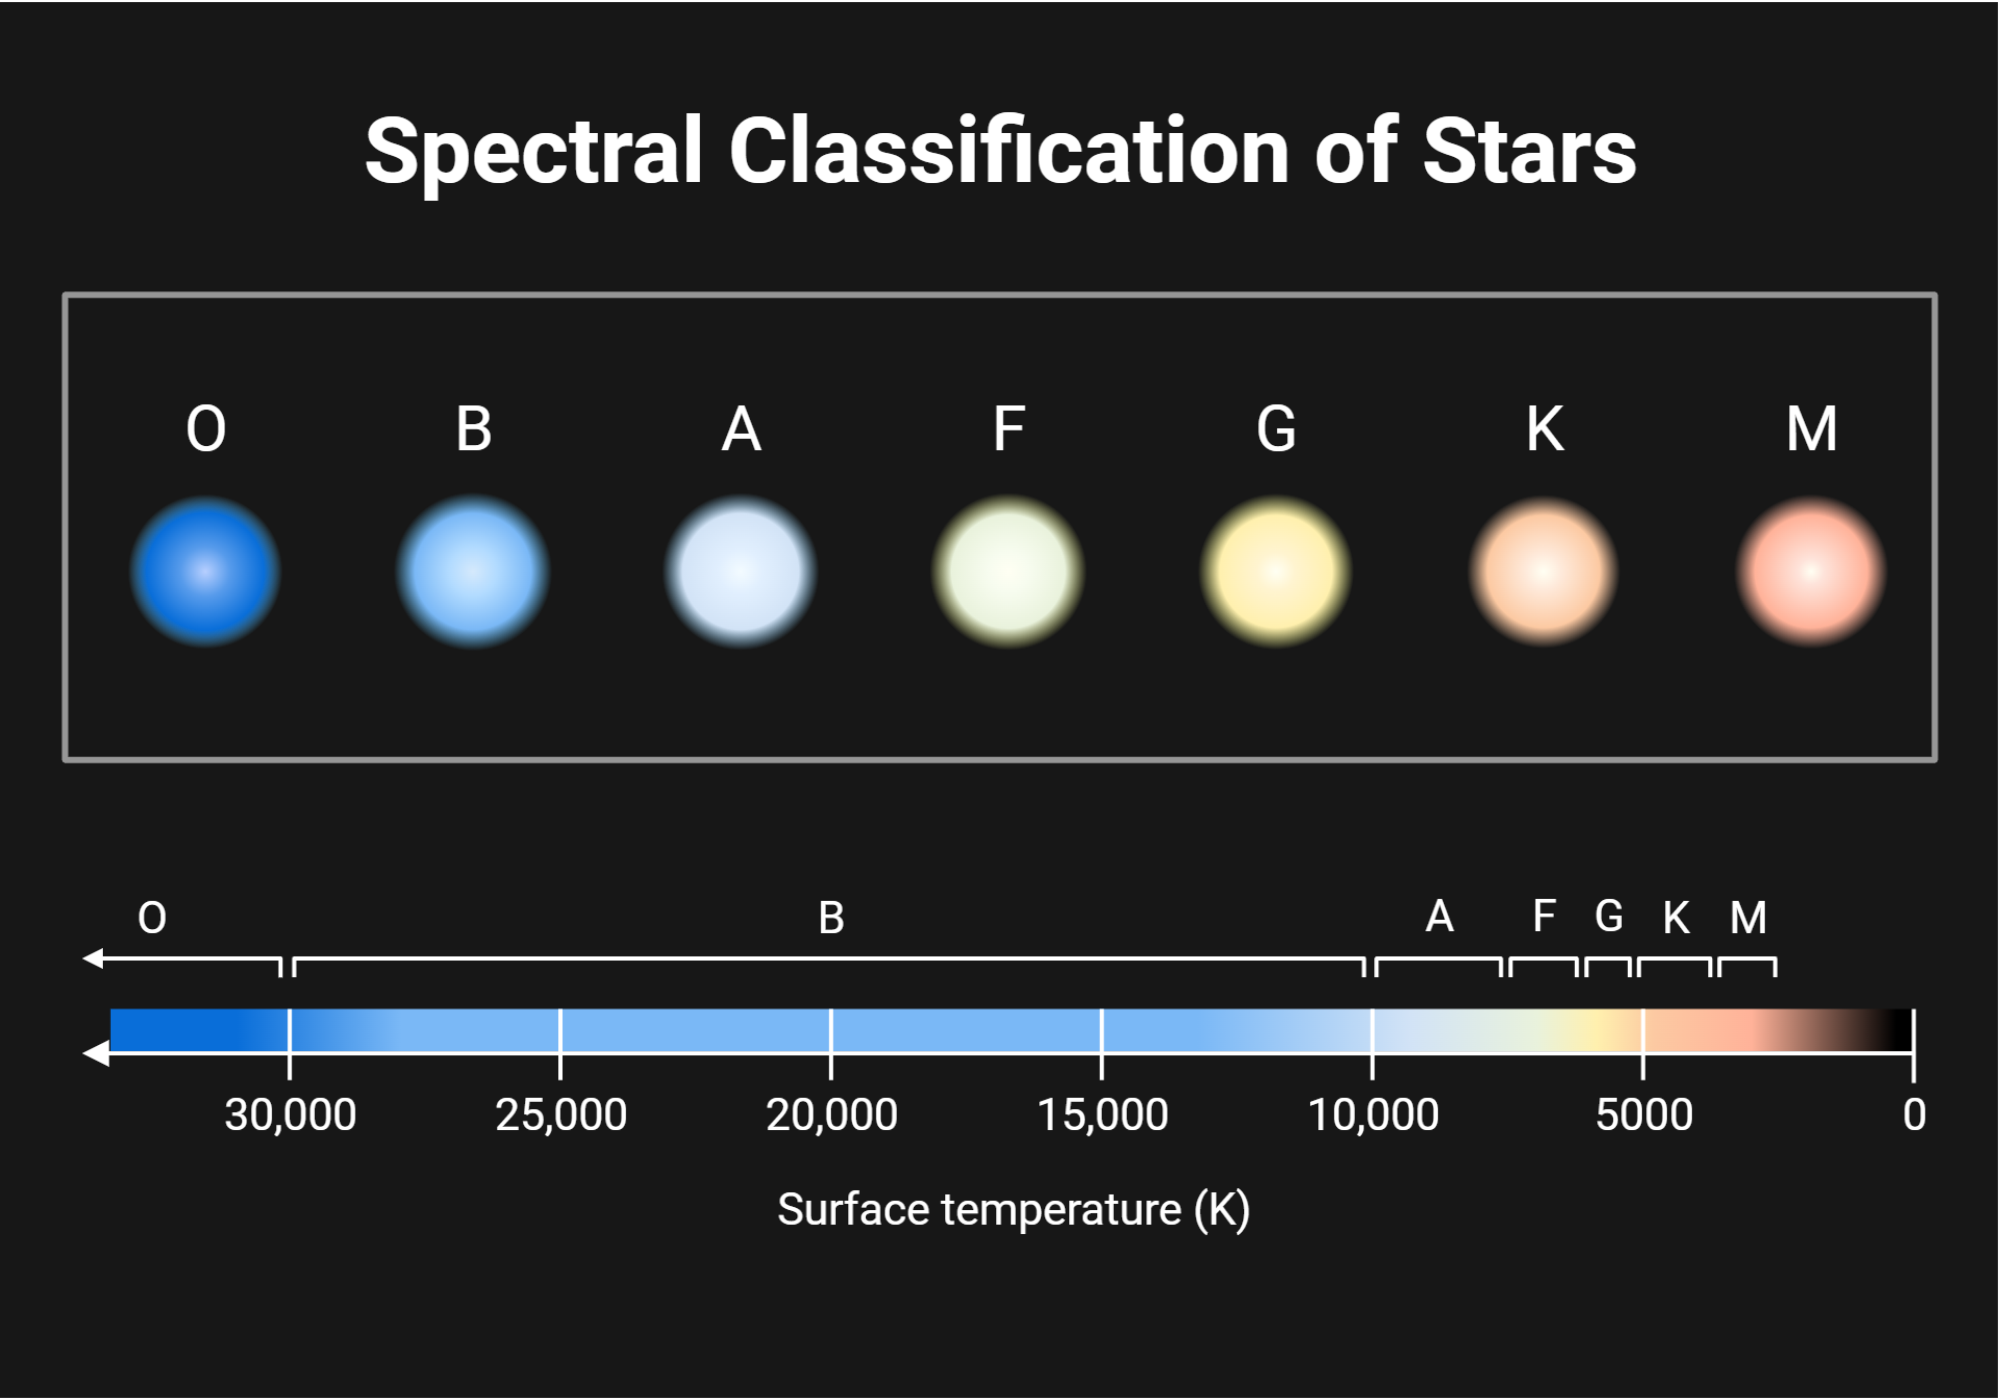
- Stars are classified by the absorption lines in their spectra, which relate to temperature and composition.
- Main spectral types: O, B, A, F, G, K, M (O = hottest, M = coolest).
- Example: The Sun is a G-type star; Sirius is an A-type star.
Doppler Effect in Spectral Lines
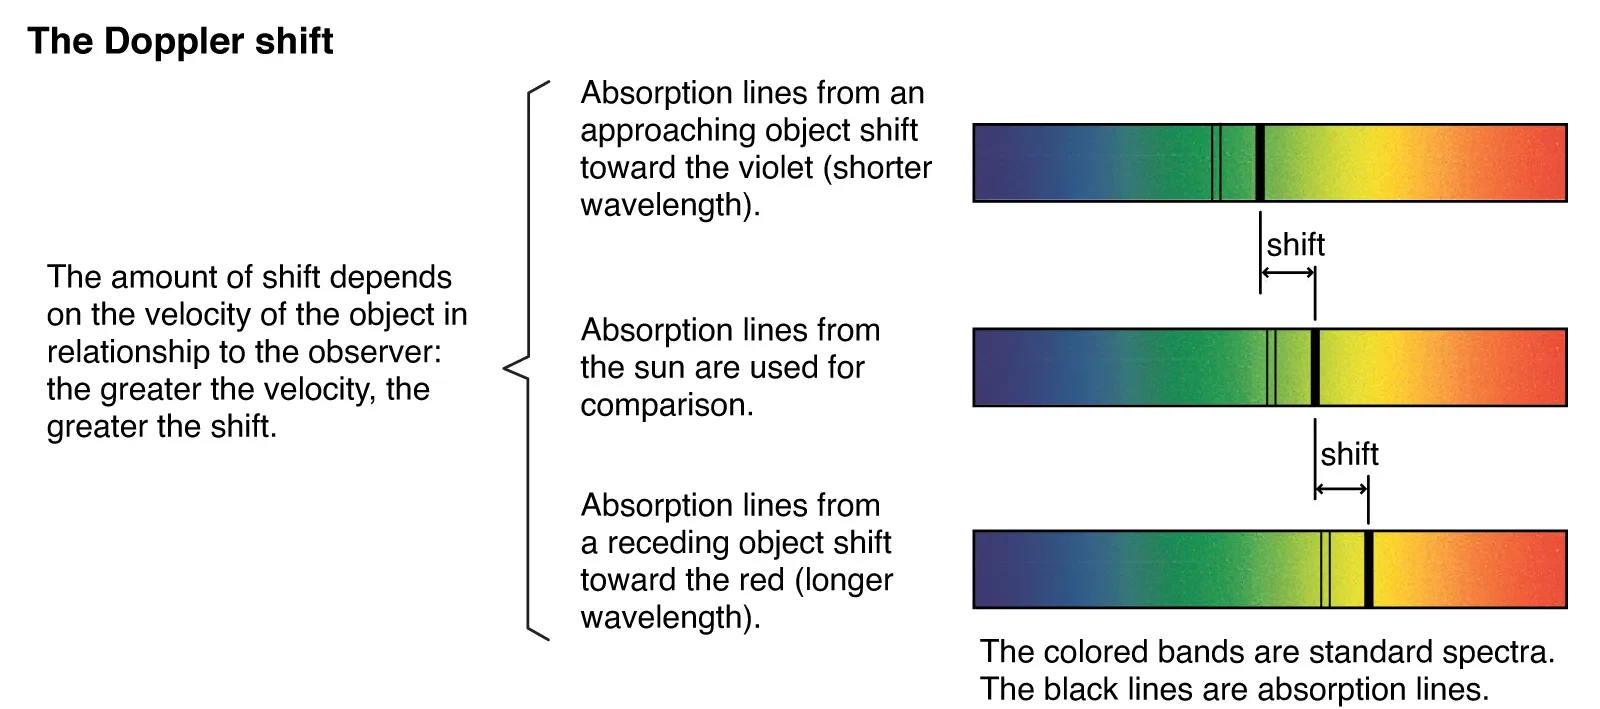
- If a star moves away, its spectral lines are redshifted (longer wavelength).
- If a star moves toward Earth, its lines are blueshifted (shorter wavelength).
- This allows astronomers to measure the star’s radial velocity and the expansion of the universe.
Importance of Spectral Analysis
- Determines chemical composition, temperature, density, mass, and motion of stars.
- Helps to classify stars, understand stellar evolution, and study galaxies.
Example:
A star’s emission spectrum shows strong hydrogen lines. What does this tell you about the star?
▶️ Answer/Explanation
The strong hydrogen lines indicate that hydrogen is abundant in the star’s atmosphere.
By comparing the intensity of lines, astronomers can also estimate the temperature and spectral type (e.g., A-type stars show strong hydrogen lines).
Example:
The spectral lines of a star are shifted towards red. What does this tell us about the star’s motion?
▶️ Answer/Explanation
Redshift indicates the star is moving away from Earth. Using the amount of shift, astronomers can calculate the radial velocity.
This observation supports the fact that the universe is expanding.
Example:
How can spectral analysis be used to classify the Sun?
▶️ Answer/Explanation
By analyzing the Sun’s absorption lines, astronomers found strong lines of hydrogen and calcium.
Comparing with spectral standards, the Sun is classified as a G-type star, which corresponds to a surface temperature of approximately 5,800 K.