Identifying Patterns in Planetary Data Tables/Diagrams
Surface Temperature Patterns
- Planets closer to the Sun (Mercury, Venus) are hotter, while outer planets are colder.
- Exception: Venus is hotter than Mercury because of its thick CO₂ atmosphere (greenhouse effect).
- Pattern: Temperature generally decreases with distance from the Sun, but atmospheric conditions can change this.
Number of Moons Patterns
- Inner planets (Mercury, Venus, Earth, Mars) have few or no moons.
- Outer planets (Jupiter, Saturn, Uranus, Neptune) have many moons, because of stronger gravity and large mass.
- Pattern: Gas giants usually have many moons; rocky planets have few or none.
Distance from the Sun Patterns
- Planets are not evenly spaced; inner planets are closer together, outer planets are more spread out.
- Pattern: Distance between planets increases as you move outward in the solar system.
Orbital Properties Patterns
- Planets closer to the Sun move faster and have shorter orbital periods (e.g., Mercury: 88 days).
- Planets farther away move slower and take longer to orbit (e.g., Neptune: 165 years).
- Pattern: Orbital period increases with distance from the Sun (Kepler’s Third Law).
Mass Patterns
- Inner planets (terrestrial) are smaller in mass, rocky, and dense.
- Outer planets (gas giants) are massive, with thick atmospheres and many moons.
- Pattern: Planet mass increases dramatically beyond the asteroid belt (Jupiter, Saturn, Uranus, Neptune).
| Planet | Distance from Sun (10⁶ km) | Surface Temp (°C) | Number of Moons | Orbital Period | Mass (Earth = 1) |
|---|---|---|---|---|---|
| Mercury | 58 | 167 | 0 | 88 days | 0.055 |
| Venus | 108 | 464 | 0 | 225 days | 0.815 |
| Earth | 150 | 15 | 1 | 365 days | 1.0 |
| Mars | 228 | -65 | 2 | 687 days | 0.107 |
| Jupiter | 778 | -110 | 92 | 12 years | 317.8 |
| Saturn | 1,427 | -140 | 83 | 29 years | 95.2 |
| Uranus | 2,871 | -195 | 27 | 84 years | 14.5 |
| Neptune | 4,498 | -200 | 14 | 165 years | 17.1 |
How to Spot Patterns in the Planetary Data (Step-by-Step)
- Step 1 : Pick two columns to compare. Examples: distance vs temperature, mass vs number of moons, distance vs orbital period.
- Step 2 : Order the rows. Sort planets by one column (e.g., increasing distance) so trends become clearer.
- Step 3 : Look for a monotonic trend. Ask: as X increases, does Y generally increase or decrease?
- Step 4 : Check ratios (relative to Earth). Convert to a simple index: \(X_\text{planet} / X_\oplus\). This reveals proportional relationships.
- Step 5 : Identify exceptions and explain them. Outliers often have a physical reason (e.g., Venus’ greenhouse effect).
- Step 6 : State the rule in words or with a simple relation. Example: Kepler’s third law \(T^2 \propto r^3\).
Example
Using the table given in Notes, verify that planets farther from the Sun take longer to orbit and check \( T^2 \propto r^3 \) with a quick ratio test.
▶️ Answer/Explanation
1) Order by distance (million km): Mercury (58), Venus (108), Earth (150), Mars (228), Jupiter (778), Saturn (1427), Uranus (2871), Neptune (4498). Orbital periods steadily grow: 88 d → 225 d → 365 d → 687 d → 12 y → 29 y → 84 y → 165 y.
2) Ratio to Earth (use Earth = 1 AU and 1 year):
Jupiter: \( r/r_\oplus \approx 778/150 \approx 5.19 \), \( T/T_\oplus \approx 12 \).
Check \( \dfrac{T^2}{r^3} \): \( \dfrac{12^2}{5.19^3} \approx \dfrac{144}{\;139.8\;} \approx 1.03 \) (≈ constant).
Neptune: \( r/r_\oplus \approx 4498/150 \approx 30 \), \( T/T_\oplus \approx 165 \).
Check \( \dfrac{T^2}{r^3} \): \( \dfrac{165^2}{30^3} = \dfrac{27225}{27000} \approx 1.01 \) (≈ constant).
Conclusion: As distance increases, orbital period increases in a way consistent with \( T^2 \propto r^3 \) (Kepler’s third law).
Example
Using the table given in Notes, Do planets farther from the Sun have lower temperatures? Use the table to test the trend and explain exceptions.
▶️ Answer/Explanation
1) Scan paired values (distance → temperature):
Mercury (58, 167), Venus (108, 464), Earth (150, 15), Mars (228, −65), Jupiter (778, −110), Saturn (1427, −140), Uranus (2871, −195), Neptune (4498, −200).
2) Pattern: Overall, temperature decreases as distance increases.
3) Exception: Venus is hotter than Mercury despite being farther. Physical reason: a dense CO\(_2\) atmosphere causes a strong greenhouse effect, trapping heat.
Conclusion: “Farther → colder” is the general rule, modified by atmospheric effects (major exception: Venus).
Example
Using the table given in Notes, Do more massive planets tend to have more moons?
▶️Answer/Explanation
1) Compare pairs (mass in Earths → moons):
Earth (1.0 → 1), Mars (0.107 → 2), Jupiter (317.8 → 92), Saturn (95.2 → 83), Uranus (14.5 → 27), Neptune (17.1 → 14).
2) Pattern: Gas giants (high mass) generally have many moons; inner rocky planets (low mass) have few.
3) Nuance/outliers: Uranus vs Neptune have similar masses but different moon counts (27 vs 14). Gravitational history, capture events, and ring–moon system dynamics affect the exact numbers.
Conclusion: Clear overall positive trend (mass ↑ → moons ↑) with natural scatter due to system history.
Example
Using the table given in Notes , to group planets and explain several columns at once (temperature, moons, mass, periods).
▶️ Answer/Explanation
1) Split into inner vs outer: Inner (Mercury–Mars): low mass, few moons, shorter periods, warmer; Outer (Jupiter–Neptune): high mass, many moons, longer periods, colder.
2) Check each column quickly:
Mass: jumps dramatically beyond Mars (e.g., Jupiter \(317.8\)).
Moons: jumps with mass (Jupiter 92, Saturn 83).
Orbital period: increases strongly outward (29 y, 84 y, 165 y).
Temperature: generally drops outward (−110 to −200 °C).
3) Explain physically: Outer planets formed beyond the “snow line,” allowing light gases and ices to accumulate → huge masses, strong gravity, and many captured moons; far from the Sun → low temperatures and long orbital periods.
Conclusion: Grouping (inner vs outer) helps you explain multiple observed patterns at once.
Example:
The planetary orbits of the solar system are often depicted as circular. However, this is not the case in reality. Based on the image of planetary orbits, what can be implied about the orbits of the planets?
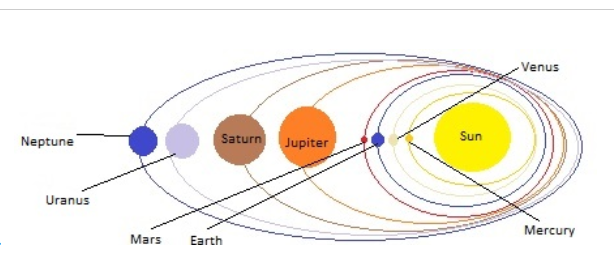
A. The planets are not always the same distance from the sun.
B. The planets are always the same distance from the sun.
C. Nothing about the orbits of the planets can be implied from this image.
D. The orbits are basically circular, with a few wobbles.
▶️ Answer/Explanation
The orbits shown in the image are elliptical, not perfectly circular. In an ellipse, the distance between the planet and the Sun varies as the planet moves along its orbit.
Thus, the correct implication is that the planets are not always at the same distance from the Sun.
Final Answer: \(\boxed{A}\)
Example:
Based on the image of the solar system, what separates the inner planets from the outer planets?
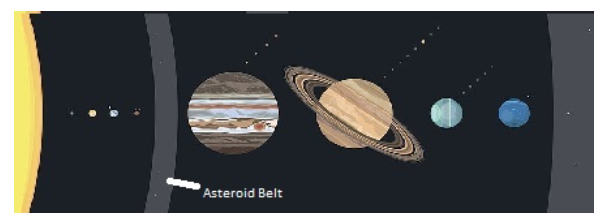
A. The Sun.
B. Jupiter.
C. Asteroid belt.
D. Nothing separates them.
▶️ Answer/Explanation
The solar system is divided into inner planets (Mercury, Venus, Earth, Mars) and outer planets (Jupiter, Saturn, Uranus, Neptune).
The dividing region between them is the Asteroid Belt, which lies between Mars and Jupiter.
Final Answer: \(\boxed{C}\)