
IBDP Economics 3.4 Economics of inequality and poverty HL Paper 1 - New Syllabus
Question
(a) Explain how the Lorenz curve and the Gini coefficient (index) may be used to measure the degree of income inequality in a country. [10]
(b) Using real-world examples, evaluate the view that the most effective way that a government can reduce inequality is through a system of progressive direct taxation. [15]
Most-appropriate topic code (CED):
▶️ Answer/Explanation
(a) Answer:
Income inequality refers to the unequal distribution of income among individuals or households in an economy. Two measures that can be used to assess the degree of income inequality are the Lorenz curve and the Gini coefficient.
The Lorenz curve is a graphical representation of the distribution of income within a country. The horizontal axis shows the cumulative percentage of the population, ranked from the poorest to the richest, while the vertical axis shows the cumulative percentage of total income received.
The 45-degree line represents perfect equality. For example, if 20% of the population received exactly 20% of national income, the distribution would lie on this line. The actual Lorenz curve normally lies below the line of equality because income is unequally distributed.
The further the Lorenz curve is below the line of perfect equality, the greater the degree of income inequality. Therefore, the Lorenz curve allows comparisons of the distribution of income between countries or between different time periods within the same country.
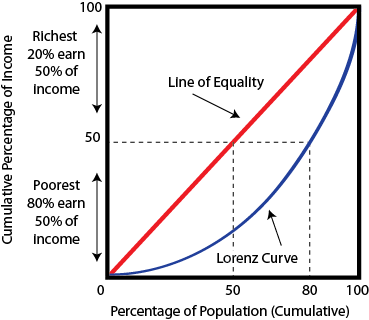
A Lorenz curve diagram should show the cumulative percentage of population on the horizontal axis and cumulative percentage of income on the vertical axis. The 45-degree line represents perfect equality, while the Lorenz curve below it represents the actual distribution of income.
The Gini coefficient is a numerical measure derived from the information contained in the Lorenz curve. It compares the area between the line of perfect equality and the Lorenz curve with the total area beneath the line of perfect equality.
The Gini coefficient ranges from 0 to 1 in its commonly used form. A value of 0 represents perfect equality, while a value of 1 represents extreme inequality, where one person receives all income. Thus, a higher Gini coefficient indicates greater income inequality, while a lower coefficient indicates a more equal distribution of income.
For example, if Country A has a Gini coefficient of 0.25 and Country B has a coefficient of 0.50, Country B has the more unequal distribution of income, assuming the figures are calculated on a comparable basis.
Therefore, the Lorenz curve provides a visual representation of income inequality, while the Gini coefficient provides a numerical summary that makes comparisons of the degree of inequality easier. Both measures can therefore be used together to assess the distribution of income within and between countries.
(b) Answer:
Progressive direct taxation refers to a system in which the proportion of income paid in direct tax increases as income increases. It can reduce inequality by taking a larger proportion of income from higher-income individuals and allowing the government to redistribute resources towards lower-income households.
Progressive taxation can directly reduce disposable-income inequality. Under a progressive income-tax system, high-income individuals pay a greater proportion of their income in tax than low-income individuals. This reduces the disposable income gap between different income groups.
The government can also use the revenue raised from progressive taxation to finance transfer payments and public services such as healthcare, education and social protection. These policies can further increase the real incomes and living standards of lower-income households.
For example, countries such as Sweden use relatively progressive taxation alongside extensive public services and social transfers. The combination can reduce post-tax and post-transfer income inequality compared with the distribution of market incomes.
Progressive taxation can also be applied to wealth and corporate income. Taxes on capital gains, property or inheritance can reduce the concentration of wealth and increase government revenue available for redistribution. This may be important because income inequality can persist across generations when wealth is highly concentrated.
However, progressive taxation may create disincentive effects. If marginal tax rates become very high, individuals may have less incentive to work additional hours, acquire skills or undertake entrepreneurial activity because a larger proportion of additional income is taxed.
Similarly, high taxes on savings and investment may reduce the incentive to save or invest. Lower investment could reduce capital accumulation and productivity, potentially reducing long-run economic growth. If growth is reduced significantly, the policy may ultimately limit improvements in living standards for both high- and low-income households.
However, the size of these disincentive effects depends on the responsiveness of individuals and firms to taxation. If labour supply and investment are relatively unresponsive to tax changes, the government may be able to redistribute income without a substantial reduction in economic activity.
Progressive taxation may also create efficiency costs. High tax rates can encourage tax avoidance or evasion, reducing the actual revenue collected. Individuals and businesses may also change their behaviour to reduce their tax liabilities. Consequently, the theoretical redistribution may be greater than the actual reduction in inequality.
Alternative policy: investment in human capital
Governments can reduce inequality by investing in education and training. Improving access to high-quality education increases the skills and productivity of lower-income individuals, allowing them to obtain higher-paying employment. This addresses inequality at its source rather than simply redistributing income after it has been earned.
For example, governments that provide heavily subsidized education and vocational training can increase the earning potential of disadvantaged workers. This may reduce structural inequality while also increasing the productive capacity of the economy.
Alternative policy: transfer payments and targeted spending
Governments can provide targeted benefits to low-income households, such as unemployment benefits, housing support or income transfers. Spending directly on healthcare and education can also improve the living standards of poorer households without requiring them to purchase these services privately.
These policies can be more targeted than general progressive taxation. However, they require government expenditure and can create dependency or disincentive effects if benefits are withdrawn rapidly as household incomes increase.
Alternative policy: minimum wages
A government can establish a minimum wage to increase the incomes of low-paid workers. This can reduce wage inequality for workers who remain employed. However, if the minimum wage is set significantly above the equilibrium wage, it may reduce the demand for labour and cause unemployment among some low-skilled workers. Therefore, its effectiveness depends on labour-market conditions.
Alternative policy: universal basic income
A universal basic income provides a regular payment to individuals regardless of their employment status. It can reduce income inequality by guaranteeing a minimum level of income. However, the cost of providing such payments to the entire population may require substantial taxation and could create significant opportunity costs for government spending.
Policies to reduce discrimination can also reduce inequality. Removing discrimination based on characteristics unrelated to productivity can improve access to employment and education for disadvantaged groups. This can reduce persistent income differences and improve equality of opportunity.
Real-world example: Nordic economies such as Sweden combine progressive taxation with substantial government spending on education, healthcare, social transfers and other public services. This demonstrates that progressive taxation can be an important component of reducing inequality, but its effectiveness is strengthened when combined with other redistribution and human-capital policies.
Overall evaluation: Progressive direct taxation is an important method of reducing income inequality because it directly reduces disposable-income differences and provides governments with revenue that can be redistributed through transfers and public services. It is particularly effective when tax administration is strong and the tax system remains sufficiently progressive without creating excessive disincentives.
However, it is unlikely to be the “most effective” method on its own. Progressive taxation primarily redistributes income after it has been earned, whereas education, training, anti-discrimination policies and targeted spending can address the underlying causes of unequal earning opportunities. Minimum wages and transfer payments can also provide more targeted support to particular groups.
Therefore, progressive direct taxation should be an important part of a government’s strategy to reduce inequality, but it is unlikely to be the single most effective policy. The greatest reduction in inequality is likely to occur when progressive taxation is combined with investment in human capital, targeted transfers and public services, while maintaining incentives for work, saving and investment.
Question
Explain how government spending might promote greater equity in an economy.
▶️Answer/Explanation
Answers may include:
- definitions of government spending, equity
- Lorenz curve diagram showing a Lorenz curve shifting closer to the line of perfect income equality because of government spending to promote equity (or a subsidy diagram or an AD/AS diagram showing increasing AD and real GDP and therefore implying increased employment)
- explanation of the linkages between government spending (eg on merit and public goods, transfer payments and subsidies), taxation and equity
- examples of actual government spending measures (eg healthcare services, education, sanitation, water supplies, public parks, public transportation, old age pensions, unemployment benefits, child allowances) that have promoted equity.