
IBDP Economics 4.6 Balance of payments SL Paper 2- New Syllabus
Question
Read the extracts and answer the questions that follow.
Text A — Overview of the United Kingdom (UK)
The United Kingdom (UK) is a country in Europe. By early 2022, its economy had recovered from a deep recession. However, there were significant risks ahead. Inflation was rising and, as demand management policies to reduce inflation took effect, the growth rate of gross domestic product (GDP) began to slow again.
Inflationary pressures were due to rising energy prices, shortages of labour and high government spending. The central bank raised interest rates several times during 2021 and 2022 because inflation rose above the target rate of 2 %. At the same time, the International Monetary Fund (IMF) recommended that government spending on infrastructure, skills and innovation should be increased.
Since 2020, the deficit on the current account of the balance of payments has increased. Higher expenditure on imports of manufactured goods, oils and other fuels added to the deficit on the balance of trade in goods.
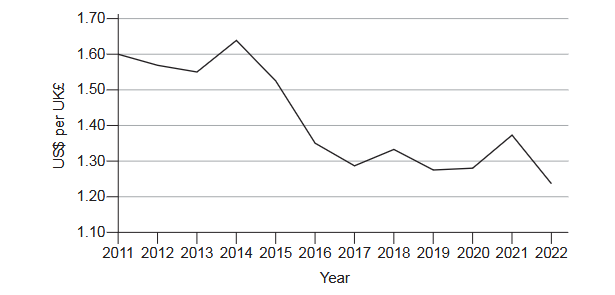
Fluctuations in the exchange rate for the pound (UK£, the UK’s currency) are considerable (Figure 1). The overall trend since 2014 has been for export prices (measured in foreign currencies) to decrease. However, the UK export market share in world trade has been gradually declining.
Currency depreciation is expected to increase inflows of foreign direct investment (FDI) and portfolio investment. However, the effect on the trade balance is less predictable, partly because imported raw materials and components are a large proportion of the cost of exported goods. The demand for UK exports of services, including banking, insurance, and business services, is price inelastic. Other factors such as quality and reputation are usually more important than price in determining demand.
In addition, UK manufacturing exports are mainly high technology goods, which are less sensitive to price changes than to other demand factors. For example, the long-run price elasticity of demand (PED) for pharmaceuticals exported from the UK has been estimated to be −0.6, whereas for machinery it is −1.1. In the short run, the PED is lower for all exported goods, averaging −0.15.
Changes in the incomes of people overseas are usually more significant in determining export demand than changes in prices. The income elasticity of demand (YED) for most UK exports is positive and can be quite high. For example, the YED is 2.6 for exports of pharmaceuticals. However, the YED is only −0.07 for exports of shoes.
Text B — Free trade agreements with Australia and New Zealand
The UK exited the European Union (EU) in 2020. Since then, free trade agreements (FTAs) have been negotiated with Australia and New Zealand. These FTAs will result in the gradual elimination of almost all tariffs. Therefore, some export sectors in the UK economy are predicted to grow, particularly in the areas of “green” technologies and digital services.
However, it is estimated that the effect of these agreements will increase UK GDP by only 0.11 % per year. While the overall benefit will be small, the negative effect on some industries will be significant. UK farmers are concerned that these FTAs could damage their competitiveness and cause UK agricultural output to fall.
Text C — The net zero strategy in the UK
The UK plans to achieve carbon neutrality by 2050. By 2035, emissions of carbon should be reduced to 22 % of the 1990 levels. As part of the net zero strategy, carbon taxes are being imposed on some goods that damage the environment due to the carbon emissions that occur during production, such as plastic packaging. Consequently, the output of plastic brings its output closer to the social optimum. In addition, there are incentives to produce innovative “green” goods that benefit the environment and can also be exported.
Table 1: Economic data for the UK
| 2011 | 2021 | |
|---|---|---|
| Real GDP per capita (UK£) | 27 996 | 30 246 |
| Unemployment (% of labour force) | 8.0 | 4.5 |
| Inflation (annual % change in consumer price index) | 3.9 | 2.5 |
| Exchange rate (US$ per UK£) | 1.61 | 1.37 |
Table 2: Selected balance of payments data for the UK (UK£ billion)
| 2011 | 2021 | |
|---|---|---|
| Balance of trade in goods | −103 | −156 |
| Balance of trade in services | 127 | |
| Income | 6 | −12 |
| Current transfers | −21 | −19 |
| Current account balance | −32 | −60 |
| FDI | 34 | 58 |
| Portfolio investment | −10 | −25 |
| Reserve assets | −5 | 18 |
Figure 1: Exchange rate from 2011 to 2022 (US$ per UK£)
(a) (i) Define the term inflation indicated in bold in the text (Text A, paragraph 1). [2]
Answer / Explanation
Inflation is a persistent or sustained increase in the general price level of goods and services in an economy over time.
(a) (ii) Define the term foreign direct investment indicated in bold in the text (Text A, paragraph 5). [2]
Answer / Explanation
Foreign direct investment (FDI) is a long-term investment made by an individual or firm, often a multinational corporation, in productive assets or business operations in another country, usually involving significant ownership or control.
(b) (i) A pharmaceutical good is priced at UK£10 per unit and the exported quantity is 200 units. The price decreases to UK£9. Using the price elasticity of demand figure for pharmaceuticals exported from the UK (Text A, paragraph 6), calculate the revenue earned in UK£ after the price change. [3]
Answer / Explanation
Initial price = UK£10; New price = UK£9; Initial quantity exported = 200 units; PED = −0.6
Percentage change in price:
\( \dfrac{9-10}{10} \times 100 = -10\% \)
Using:
\( PED = \dfrac{\%\Delta Q_d}{\%\Delta P} \)
\( -0.6 = \dfrac{\%\Delta Q_d}{-10} \)
Therefore:
\( \%\Delta Q_d = 6\% \)
New quantity demanded:
\( 200 \times 1.06 = 212 \text{ units} \)
Therefore, the new revenue is:
\( \text{Revenue} = \text{Price} \times \text{Quantity} \)
\( = UK£9 \times 212 = UK£1908 \)
Answer: UK£1908
(b) (ii) Using information from Table 2, calculate the balance of trade in services (UK£ billion) for the UK in 2011. [2]
Answer / Explanation
The current account balance is calculated as:
\( \text{Balance of trade in goods} + \text{Balance of trade in services} + \text{Income} + \text{Current transfers} = \text{Current account balance} \)
Therefore:
\( -103 + X + 6 – 21 = -32 \)
\( X – 118 = -32 \)
\( X = 86 \)
Answer: UK£86 billion surplus
(c) Using an AD/AS diagram, explain the likely effect on the full employment (potential) level of output in the UK if government spending on infrastructure is increased (Text A, paragraph 2). [4]
Answer / Explanation
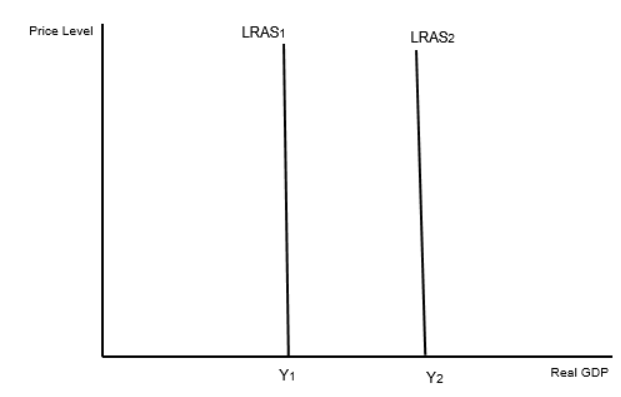
Increased government spending on infrastructure is an interventionist supply-side policy. Investment in infrastructure can improve the efficiency and productivity of firms and increase the quantity and/or quality of factors of production.
This increases the productive capacity of the economy, causing the LRAS curve to shift to the right from LRAS₁ to LRAS₂.
Consequently, the full employment (potential) level of output increases from Y₁ to Y₂. This represents an increase in the economy’s potential real GDP and therefore promotes long-term economic growth.
(d) Using an exchange rate diagram, explain the likely effect on the exchange rate for the pound (UK£) of increased international demand for “green” goods produced in the UK (Text C). [4]
Answer / Explanation
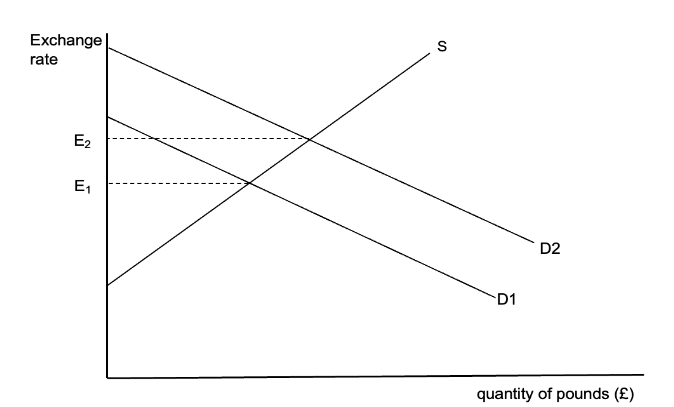
Increased international demand for UK-produced green goods means that foreigners will purchase more UK exports.
To purchase these exports, foreign buyers need to obtain more UK pounds. Therefore, the demand for the pound increases, shifting the demand curve for pounds to the right.
The increased demand for pounds causes the equilibrium exchange rate to rise. Therefore, the pound appreciates.
(e) Using an international trade diagram, explain how imports of agricultural goods to the UK are likely to change as a result of the free trade agreements with Australia and New Zealand (Text B, paragraph 2). [4]
Answer / Explanation
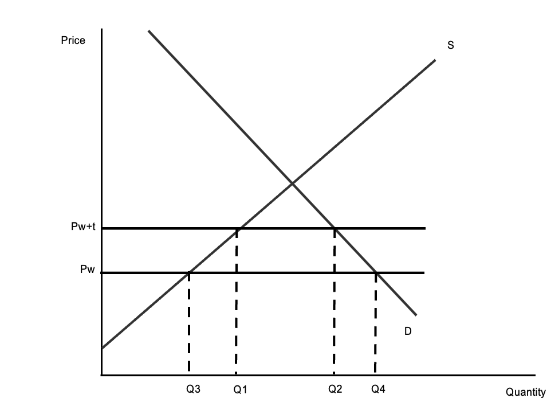
The free trade agreements with Australia and New Zealand involve the gradual elimination of almost all tariffs. Therefore, the tariff on agricultural imports from these countries will fall.
The reduction in tariffs lowers the domestic price of imported agricultural goods towards the world price. As agricultural goods become cheaper, domestic consumption increases while domestic production decreases.
Since imports are equal to the difference between domestic consumption and domestic production, the quantity of agricultural imports into the UK increases.
(f) Using an externalities diagram, explain why a carbon tax on the production of plastic could cause its output to move closer to the social optimum (Text C). [4]
Answer / Explanation
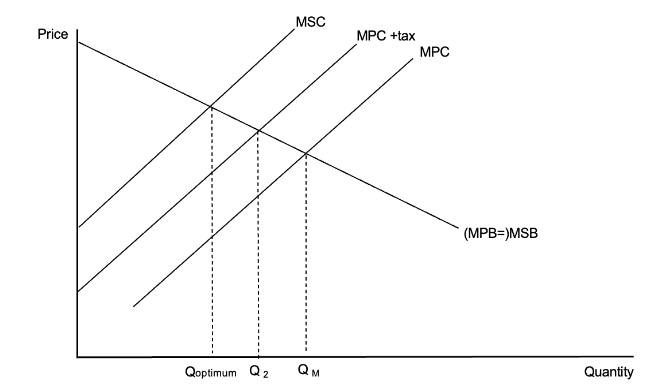
Plastic production creates a negative production externality because it can impose external costs on third parties, such as environmental damage.
Without government intervention, firms consider only their marginal private cost (MPC), so the market produces at Qₘ, which is greater than the socially optimal output.
A carbon tax increases firms’ costs of production and shifts the MPC curve upwards/leftwards, bringing it closer to the marginal social cost (MSC) curve.
As a result, the market quantity of plastic falls from Qₘ towards Q_optimum. Therefore, the carbon tax internalizes some of the external cost and moves production closer to the socially optimal level.
(g) Using information from the text/data and your knowledge of economics, discuss the likely effects of the exchange rate trend from 2011 to 2022 (shown in Figure 1) on the UK balance of payments and the UK economy. [15]
Answer / Explanation
The exchange rate of the pound fell overall from approximately US$1.61 per UK£ in 2011 to around US$1.24 in 2022. This represents an overall depreciation of the pound, although there were fluctuations during the period.
Effects on the balance of payments
In theory, a depreciation makes UK exports cheaper in foreign-currency terms and imports more expensive in UK-pound terms. Therefore, export demand may increase while demand for imports may decrease, potentially improving the balance of trade and the current account balance.
However, the UK’s data suggests that this improvement did not occur. The balance of trade in goods deteriorated from a deficit of UK£103 billion in 2011 to a deficit of UK£156 billion in 2021. The current account deficit also increased from UK£32 billion to UK£60 billion over the same period.
One explanation is that the UK’s exports have relatively price-inelastic demand. For example, the long-run PED for UK pharmaceutical exports is −0.6, while the short-run average PED for exports is only −0.15. Therefore, a depreciation may not generate a sufficiently large increase in export demand to improve export revenue.
In addition, imported raw materials and components form a large proportion of the cost of exported goods. A depreciation raises the UK-pound price of these imported inputs, increasing production costs and reducing some of the competitiveness gained from the depreciation.
The depreciation may nevertheless encourage foreign direct investment (FDI), because UK assets and production become relatively cheaper for foreign investors. This is consistent with FDI increasing from UK£34 billion in 2011 to UK£58 billion in 2021. Increased FDI can provide funds for investment and potentially increase productive capacity and output.
Effects on economic growth and employment
A depreciation can increase aggregate demand because exports become cheaper to foreign consumers while imports become more expensive. If export demand responds sufficiently, net exports increase and AD shifts to the right, increasing real GDP and employment.
The data provides some evidence consistent with this outcome. The UK’s unemployment rate fell from 8.0 % in 2011 to 4.5 % in 2021. However, this cannot be attributed solely to the depreciation because other factors also affect employment and economic growth.
Furthermore, the UK’s share of world export markets has been gradually declining. This suggests that factors other than price, such as the quality and reputation of exports and the income of trading partners, may be more important determinants of export demand.
The YED for pharmaceuticals is 2.6, showing that rising incomes overseas can have a significant effect on demand for UK exports. Therefore, changes in foreign incomes may have a greater effect on UK exports than the depreciation of the pound.
Effects on inflation
A major disadvantage of depreciation is that imported goods and raw materials become more expensive in domestic currency. This increases firms’ production costs and can create cost-push inflation.
This is particularly important for the UK because imported energy and other inputs are significant. The depreciation therefore adds to inflationary pressures by increasing the domestic price of imports.
However, the inflationary effect depends on the extent of the depreciation and the proportion of imported goods and inputs in domestic consumption and production. The UK’s inflation rate was 3.9 % in 2011 and 2.5 % in 2021, indicating that depreciation does not automatically result in a permanently higher inflation rate.
Overall evaluation
Overall, the depreciation of the pound could potentially improve the UK’s balance of payments and increase real GDP through higher net exports. However, the evidence suggests that these benefits have been limited. The UK’s trade in goods and current account deficits both became larger despite the depreciation.
The effectiveness of depreciation depends heavily on the price elasticities of demand for exports and imports, the availability of domestic substitutes, the cost of imported inputs and the economic conditions of trading partners. Since many UK exports are relatively price inelastic and the UK relies on imported inputs, the depreciation has not necessarily produced a significant improvement in the trade balance.
At the same time, the depreciation may have supported FDI, employment and exports of green goods. Therefore, its overall effect on the UK economy is mixed: it can support growth and investment, but it can also worsen inflationary pressures and does not guarantee an improvement in the current account.
Most-appropriate topic codes (CED):