
IBDP Economics 4.1 Benefits of international trade SL Paper 2- New Syllabus
Question
Read the extracts and answer the questions that follow.
Text A — Overview of the economy and government policies in Kenya
Kenya, in East Africa, is achieving high annual economic growth rates, averaging above 5 %. Living standards are improving and employment is increasing in the manufacturing, tourism, construction and education sectors. Kenya’s high growth is also changing the distribution of income and affecting the environment. However, climate change, high levels of inequality and youth unemployment may reduce future growth rates.
Floods and droughts are severe and frequent. In 2022–2023, droughts caused agricultural output to fall, affecting the employment of 40 % of the population and doubling the number of people with insufficient food. The government took measures to increase food supplies, such as providing temporary subsidies for food and fuel. It did not impose a price ceiling for essential food.
The rising price of food is the main cause of inflation in Kenya. The central bank used a contractionary monetary policy in 2022 and 2023 to reduce inflation and to prevent the depreciation of the country’s currency (Kenyan shilling, KES).
The budget deficit as a percentage of gross domestic product (GDP) became smaller in 2023 because government expenditure grew more slowly than GDP. Moreover, economic growth resulted in higher tax revenue from both income tax and a 16 % indirect tax on goods and services. In addition, the taxes on alcohol and tobacco were raised. The government is also receiving revenue from the sale of some state-owned enterprises (SOEs). A World Bank programme, aimed at an expansion of “green” energy in Kenya, provides financial and technological support to the Kenya Power and Lighting Company, an SOE that has been making losses.
The currency depreciation in 2022 boosted exports. Services, which are approximately 38 % of total exports and include tourism and financial services, are growing faster than exports of goods. Manufactured goods account for 37 % of total exports and agricultural goods account for 25 %. Revenue from exports of tea, flowers, vegetables, meat, and coffee are volatile and unpredictable. The droughts in 2022–2023 reduced output, which lowered export revenue from vegetables and flowers by almost 20 %. The supply of tea also fell. However, the global price of tea rose, because Kenya is a major exporter of tea. Therefore, the revenue from selling tea increased by 12 % due to its price inelastic demand.
Text B — Unequal distribution of the benefits of economic growth in Kenya
Although economic growth has contributed to reductions in absolute poverty since the early 2000s, inequality remains a problem, particularly between the formal and informal sectors and between the urban and rural areas. Rural poverty is caused by low agricultural productivity and farmers’ limited access to markets, finance, and technology. As a result, agricultural investment and output have fallen. Meanwhile, the output of manufactured goods and services has increased significantly.
Electricity is used by 90 % of urban households but only 36 % of rural households. Rural households also have much more limited access to clean drinking water and less health insurance coverage than urban households.
However, the level of education has improved significantly, with a literacy rate of over 90 %. Secondary school attendance rates have increased from 13 % in 2003 to 49 % in 2022, despite the costs of attending school, and have become approximately equal for boys and girls in primary and secondary schools.
In 2022, the government introduced a fund (the Hustler Fund), partly financed by foreign aid. The fund provides low-interest loans to women, young people, and small firms, for education or investment.
Text C — Reducing and adapting to climate change in Kenya
Global warming is affecting the Kenyan economy. Consequently, agricultural output and tourism, which account for 70 % of employment and most exports, will probably decline. Therefore, GDP could fall by 2 % annually. However, Kenya has relatively low carbon emissions, particularly because renewable resources generate 90 % of electricity, a figure that is planned to rise to 100 % by 2030.
Most households still use fossil fuels for cooking and the carbon emissions from trucks, cars, and industry are very high. Therefore, the International Monetary Fund (IMF) recommends the implementation of a carbon tax. Climate-related policies and investments, such as renewable energy and forestry programmes, will reduce environmental disasters and increase economic growth and jobs in the formal sector.
Table 1: Balance of payments accounts for Kenya in billions of USA dollars (USD)
| 2023 | |
|---|---|
| Exports of goods | 8.66 |
| Imports of goods | 20.90 |
| Balance of trade in services | 1.61 |
| Income | −2.67 |
| Current transfers | 6.98 |
Table 2: Economic data for Kenya
| 2015 | 2022 | |
|---|---|---|
| Real GDP per capita (USA dollars (USD)) | 1497 | 1755 |
| Balance of trade in goods and services (USD billion) | −7.06 | −10.50 |
| Exchange rate (KES per USD) | 98 | 118 |
Table 3: Development data for Kenya
| 2015 | 2022 | |
|---|---|---|
| Gini coefficient | 0.408 | 0.387* |
| Absolute poverty (% of population living on less than USD 2.15 (2017 PPP) per day) | 29.4 | 36.1* |
| Employment in the informal sector (% of total employment) | 83 | 83 |
| Human Development Index (HDI) | 0.561 | 0.601 |
| Inequality adjusted Human Development Index (IHDI) | 0.412 | 0.438 |
* estimate
(a) (i) Define the term price ceiling indicated in bold in the text (Text A, paragraph 2). [2]
Answer / Explanation
A price ceiling is a maximum price set by the government or another authority above which producers or sellers may not charge. It is normally set below the market equilibrium price to make a good more affordable.
(a) (ii) Define the term carbon tax indicated in bold in the text (Text C, paragraph 2). [2]
Answer / Explanation
A carbon tax is an indirect tax imposed on emissions, particularly emissions from fossil fuels, in order to reduce negative externalities and encourage lower pollution.
(b) (i) Using information from Table 1, calculate the current account on Kenya’s balance of payments for 2023 in billions of USD. [1]
Answer / Explanation
Current account = Exports of goods − Imports of goods + Balance of trade in services + Income + Current transfers
= 8.66 − 20.90 + 1.61 − 2.67 + 6.98
= −6.32 billion USD
(b) (ii) Assume that the price of a kilogram of tea, exported from Kenya in 2022, was 340 Kenyan shillings (KES). Using information from Table 2, calculate the price of a kilogram of tea in USD in 2022. [2]
Answer / Explanation
Exchange rate = 118 KES = 1 USD
Price in USD = 340 ÷ 118
= 2.88 USD per kg
(b) (iii) Sketch a production possibilities curve (PPC) diagram to show how the increased output of manufactured goods may lead to decreased agricultural output in Kenya, if all resources are already fully employed (Text B, paragraph 1). [2]
Answer / Explanation
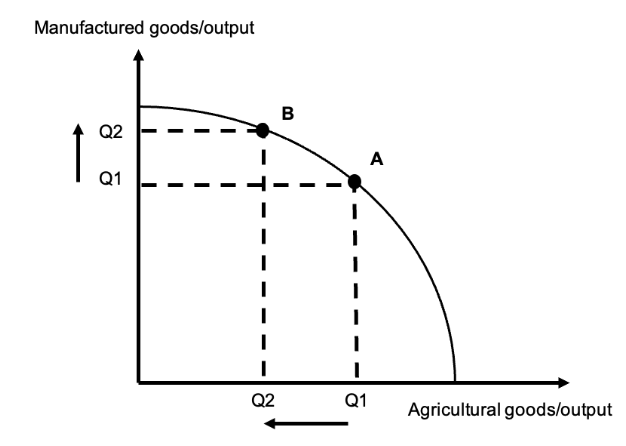
The PPC should show manufactured goods/output increasing while agricultural goods/output decreases. With all resources fully employed, producing more manufactured goods requires resources to be transferred away from agriculture, creating an opportunity cost.
(c) Using an exchange rate diagram, explain the likely effect on the exchange rate for the Kenyan shilling (KES) of the reduced export revenue from vegetables and flowers (Text A, paragraph 5). [4]
Answer / Explanation
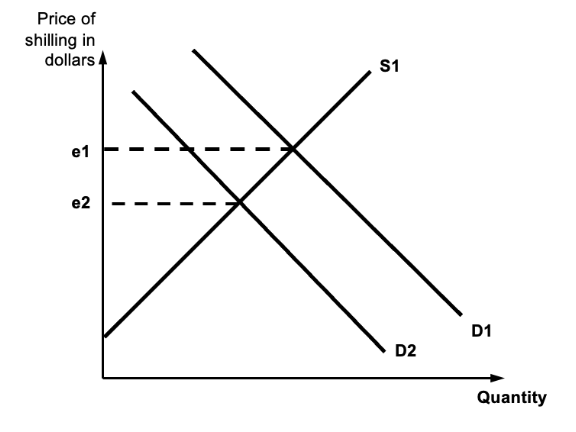
Foreign buyers of Kenyan exports need to purchase KES to pay Kenyan exporters. A reduction in export revenue from vegetables and flowers therefore reduces the foreign demand for KES.
In the exchange rate market, the demand for KES shifts to the left. This lowers the equilibrium exchange rate/value of the Kenyan shilling, causing the KES to depreciate.
(d) Using a demand and supply diagram, explain how price inelastic demand for tea causes the revenue from selling tea to increase when the supply decreases (Text A, paragraph 5). [4]
Answer / Explanation
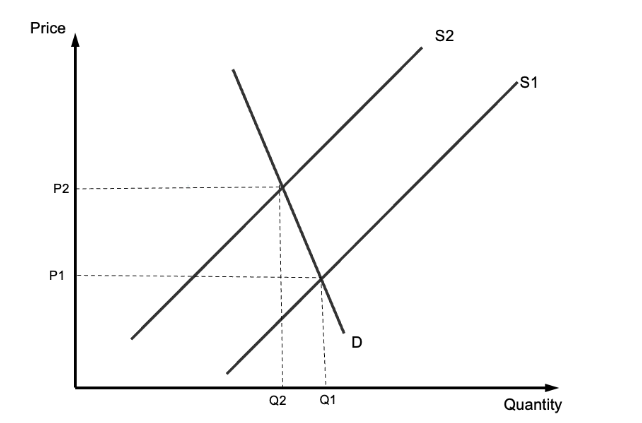
A fall in the supply of tea shifts the supply curve to the left, causing the equilibrium price of tea to rise and equilibrium quantity to fall.
Because demand is price inelastic, the proportionate change in quantity demanded is smaller than the proportionate change in price. Therefore, the percentage increase in price is greater than the percentage decrease in quantity sold.
Since total revenue = price × quantity, the increase in price is sufficiently large to outweigh the fall in quantity, causing total revenue from tea to increase.
(e) Using an externalities diagram, explain why the use of fossil fuels for cooking by Kenyan households may cause market failure (Text C, paragraph 2). [4]
Answer / Explanation
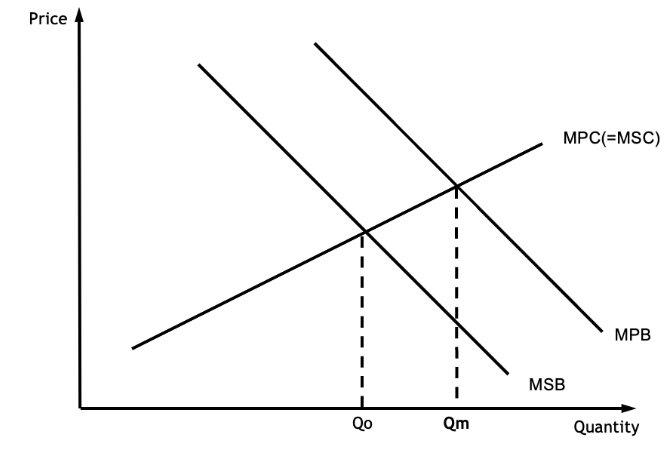
The consumption of fossil fuels creates negative externalities, such as carbon emissions and pollution, imposing external costs on third parties.
Therefore, the marginal social benefit (MSB) is below the marginal private benefit (MPB). The market equilibrium quantity of fossil-fuel consumption is greater than the socially optimum quantity.
This results in a welfare loss and misallocation of resources, meaning the market fails to achieve allocative efficiency.
(f) Using an AD/AS diagram, explain how the change in Kenya’s balance of trade in goods and services between 2015 and 2022 may have affected its real GDP (Table 2). [4]
Answer / Explanation
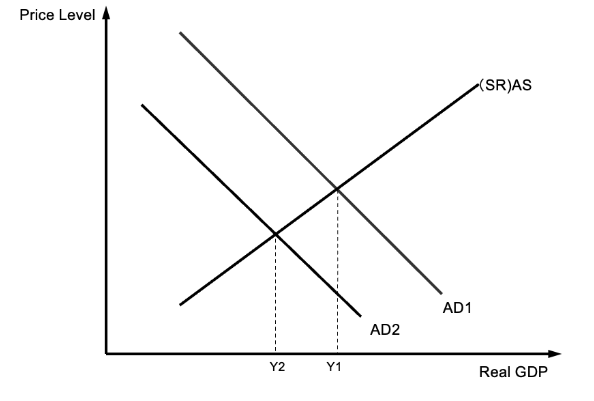
Kenya’s balance of trade in goods and services deteriorated from −7.06 billion USD in 2015 to −10.50 billion USD in 2022. This represents a widening trade deficit and therefore a more negative contribution from net exports (X − M) to aggregate demand.
As net exports fall, aggregate demand decreases, shifting the AD curve to the left. Assuming other factors remain unchanged, the equilibrium level of real GDP falls.
(g) Using information from the text/data and your knowledge of economics, discuss the impact of high economic growth on the distribution of income in Kenya. [15]
Answer / Explanation
Economic growth is an increase in the real output of an economy over time. High economic growth can improve income distribution by increasing employment, incomes and government tax revenue. However, the benefits depend on which sectors and groups receive the additional income.
Growth can reduce inequality. Kenya’s Gini coefficient fell from 0.408 in 2015 to 0.387 in 2022, suggesting an improvement in the distribution of income. Earlier economic growth also contributed to reductions in absolute poverty. Growth in manufacturing, tourism, construction and education has increased employment opportunities outside agriculture. This can raise incomes for workers moving into higher-productivity formal-sector employment.
Higher economic activity also increases government tax revenue. The text states that Kenya’s economic growth generated higher income-tax and indirect-tax revenue. This gives the government greater ability to finance transfer payments and public services, which can redistribute income towards lower-income households.
Improved education may also make growth more inclusive. Secondary-school attendance increased from 13 % in 2003 to 49 % in 2022, while literacy is above 90 %. Greater access to education increases human capital and can improve employment opportunities and future earnings, reducing inequality of opportunity.
The Hustler Fund, which provides low-interest loans to women, young people and small firms, can further distribute the benefits of growth. Improved access to finance allows lower-income groups and small businesses to invest, create income and participate more fully in economic activity.
However, high economic growth does not necessarily reduce inequality. The benefits of growth have been uneven between rural and urban areas and between the formal and informal sectors. Agricultural output and investment have fallen because of low productivity and limited access to markets, finance and technology. Since many rural households depend on agriculture, their incomes may stagnate while manufacturing and services expand.
The informal sector accounts for 83 % of total employment in both 2015 and 2022. This suggests that a large proportion of workers may not be benefiting from the higher and more stable wages, benefits and employment protections associated with formal-sector employment.
There is also evidence of continued deprivation. Absolute poverty increased from 29.4 % in 2015 to an estimated 36.1 % in 2022. This may reflect agricultural supply shocks, droughts and food insecurity, showing that economic growth alone does not guarantee an improvement in the incomes of the poorest households.
Furthermore, the rise in the price of food can disproportionately affect low-income households because they spend a larger proportion of their income on necessities. The depreciation of the KES may increase export revenue and support growth, but it also raises the domestic price of imported food and fuel, potentially worsening income inequality.
Economic growth has nevertheless been accompanied by improvements in broader development indicators. Kenya’s HDI increased from 0.561 to 0.601 between 2015 and 2022, suggesting improvements in income, health and education. However, the IHDI was considerably lower than the HDI, indicating that inequality in access to these benefits remains significant.
Overall, high economic growth in Kenya appears to have had a mixed impact on income distribution. The fall in the Gini coefficient, increased education, expansion of employment in manufacturing and services, and government support programmes suggest that some benefits have been redistributed towards lower-income groups. However, the persistence of high informal employment, rural–urban inequalities and the increase in absolute poverty show that growth has not been equally shared. Therefore, the impact depends strongly on the structure of growth and on government policies that ensure that the benefits reach poorer and rural households.
Most-appropriate topic codes (CED):