
IBDP Economics 3.4 Economics of inequality and poverty SL Paper 1 - New Syllabus
Question
(a) Explain how the Lorenz curve diagram may be used to measure a change in the distribution of income. [10]
(b) Using real-world examples, discuss the role of taxation in reducing income and wealth inequalities. [15]
Most-appropriate topic code (CED):
▶️ Answer/Explanation
(a) Answer:
The Lorenz curve is a diagram used to show the distribution of income within a country. The horizontal axis shows the cumulative percentage of the population, while the vertical axis shows the cumulative percentage of national income received by that population.
The line of perfect income equality is a 45° line showing a situation where income is distributed equally. For example, if the lowest 20% of the population receives 20% of national income, the distribution would lie on this line. Similarly, 50% of the population would receive 50% of income.
The actual Lorenz curve normally lies below the line of perfect equality because income is not distributed equally. The further the Lorenz curve lies away from the line of perfect equality, the greater the degree of income inequality.
A change in income distribution can therefore be shown by comparing two Lorenz curves. If the Lorenz curve moves closer to the line of perfect equality, income distribution has become more equal. If it moves further away, income inequality has increased.
For example, suppose the bottom 40% of households initially receive 15% of national income. If, after a change in income distribution, they receive 20%, the Lorenz curve would move closer to the equality line, indicating a more equal distribution.
The Lorenz curve is also related to the Gini coefficient. The Gini coefficient summarizes the information contained in the Lorenz curve numerically. A coefficient closer to 0 indicates greater equality, while a coefficient closer to 1 indicates greater inequality.
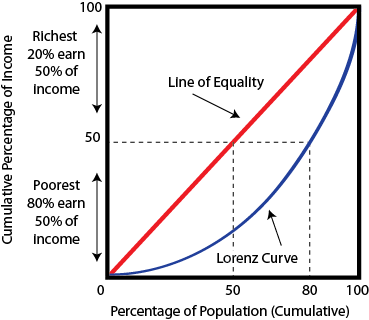
The diagram should contain the line of perfect equality and at least two Lorenz curves. A Lorenz curve closer to the equality line represents a more equal distribution, while one further away represents greater inequality.
Therefore, comparing the position of Lorenz curves over time allows economists to identify whether the distribution of income has become more or less equal and to assess the degree of change in income inequality.
(b) Answer:
Taxation can play an important role in reducing income and wealth inequalities by transferring resources from higher-income groups to lower-income groups and providing the government with revenue to finance redistribution and public services.
Progressive direct taxation is particularly important. Under a progressive income tax system, the proportion of income paid in tax rises as income increases. This means higher-income households pay a greater proportion of their income in taxation than lower-income households.
The government can then use the revenue raised to finance transfer payments, education, healthcare and other public services that benefit lower-income households. This can increase the disposable income and living standards of poorer households and reduce income inequality.
For example, countries such as the United Kingdom use progressive income taxation alongside transfer payments and publicly funded services. This redistribution can reduce the inequality that would otherwise exist in the distribution of disposable income.
Governments can also use corporate taxation to collect revenue from companies. The revenue can be used to finance government expenditure that benefits lower-income groups. However, the ultimate distributional effect depends on who ultimately bears the burden of the corporate tax.
Wealth taxation can address inequality in the ownership of assets rather than simply differences in current income. Taxes on property, capital gains, inheritances or other forms of wealth can reduce the accumulation or transfer of wealth among high-wealth households and generate government revenue for redistribution.
This is particularly important because wealth inequality can be much greater than income inequality. A person may have relatively low current income but substantial accumulated assets, while another person may have income but little wealth.
Indirect taxation, such as VAT or sales taxes, also provides substantial government revenue. Governments can use this revenue to finance transfer payments and public services that support lower-income households. However, indirect taxes are generally regressive because lower-income households may spend a larger proportion of their income on consumption.
For example, if a low-income household spends almost all of its income on consumption while a high-income household saves a significant proportion of its income, an indirect tax can represent a larger proportion of the low-income household’s income. Therefore, indirect taxation alone may actually worsen income inequality.
Nevertheless, the overall effect of taxation depends on how the revenue is used. If revenue from indirect taxes finances highly targeted transfer payments or free healthcare and education for low-income households, the overall redistribution may still reduce inequality.
However, progressive direct taxation has potential disadvantages. High marginal tax rates may reduce incentives to work, save or invest. Some high-income individuals may reduce their labour supply or seek ways to avoid or evade taxation. If investment falls, economic growth may be reduced, potentially limiting future employment and income opportunities.
There may also be an impact on entrepreneurship and innovation. If individuals receive a smaller after-tax return from successful investment or entrepreneurial activity, they may have weaker incentives to take risks. However, the strength of this effect depends on the design of the tax system and the responsiveness of individuals to tax rates.
Taxation can also have effects on economic growth. If taxation becomes excessive, it may reduce incentives for investment and consumption. On the other hand, tax revenue used effectively for education, healthcare and infrastructure can increase human capital and productivity, potentially supporting long-term economic growth.
There are also practical difficulties in taxing wealth. Wealth can be difficult to value and may be held in different forms or jurisdictions. High-net-worth individuals may also have greater opportunities for legal tax avoidance or transferring assets abroad.
Real-world example: Scandinavian economies such as Sweden combine relatively high taxation with extensive government provision of healthcare, education and social transfers. This can contribute to a relatively more equal distribution of disposable income, although the precise effects depend on the overall tax-and-transfer system rather than taxation alone.
Overall evaluation: Taxation can be an effective instrument for reducing income inequality, particularly when progressive direct taxes are combined with transfer payments and publicly provided merit goods. Wealth-related taxation can additionally address differences in accumulated wealth.
However, taxation by itself does not guarantee a reduction in inequality. Progressive taxation may create disincentive effects, while indirect taxation can be regressive. The effectiveness of taxation therefore depends heavily on the structure of the tax system and how the government uses the revenue collected.
Therefore, taxation is an important tool for reducing both income and wealth inequalities, but its effectiveness is greatest when progressive direct and wealth-related taxes are combined with well-targeted government spending, transfer payments and access to education and healthcare. A balanced policy approach is more likely to reduce inequality without creating excessive disincentives to work, save and invest.
Question
Explain how income inequality might be measured in a country.
▶️Answer/Explanation
Answers may include:
- definition of income inequality
- diagram to show a Lorenz curve and how the Gini co-efficient is derived
- explanation of the methods used to measure income inequality: Lorenz curve, Gini co-efficient
- examples of countries with income inequality.