
IBDP Economics 3.7 Supply-side policies SL Paper 2- New Syllabus
Question
Read the extracts and answer the questions that follow.
Text D — Overview of Bhutan
Bhutan is a lower-middle income country in southern Asia. It is mountainous, water is plentiful, and 60 % of the territory is protected forest. Since 2008, Bhutan has measured its economic development by changes in its “Gross National Happiness” (GNH) index. The index considers factors such as income inequality, environmental conservation, sustainable development, and gender equality, in addition to the components of the Human Development Index (HDI).
The pursuit of GNH has involved using government programmes to spread the benefits of economic growth across all social groups. An example of this is the construction of large hydropower plants, not only for the export of electricity but also to ensure that remote communities can buy power at low prices. Hydropower is a renewable method of producing electricity using the natural flow of water. With these new plants, all rural and urban areas had access to electricity by 2019.
Government intervention in the market for electricity has been necessary due to the high cost of resources. Both the production and distribution of electricity are therefore controlled by state-owned enterprises. Bhutan’s government has relied on India for grants and loans to finance hydropower projects.
Sales of surplus electricity to India, amounting to over 70 % of electricity generation in 2021, have increased the funds available to the government for investment in healthcare and education. These revenues have also helped to finance the expansion of essential infrastructure, particularly road networks. The government’s aim has been to reduce poverty and to improve well-being, especially in rural areas.
Hydropower has proved to be an important source of economic development. However, the private sector faces a lack of investment for multiple reasons, including high transport costs and a small domestic market. This has limited the creation of new private sector jobs. Furthermore, a sustainability tax of 100 United States dollars (USD) per night for tourists helps with Bhutan’s conservation efforts. The tax reduces Bhutan’s competitiveness as a tourist destination.
Agriculture is vital to Bhutan’s largely rural population. This sector employed 55 % of the workforce in 2021. However, most agricultural produce, such as rice, is consumed by farming households rather than sold in the market. By 2021, the country was importing about 50 % of its food. The growing food demands of urban areas could have negative consequences for the balance of payments.
Agricultural output is constrained by many factors, including a lack of machinery, irrigation and affordable credit. Bhutan’s partnership with the United Nations International Fund for Agricultural Development has provided funds for investment in the agricultural sector, such as irrigation systems, roads connecting farms to markets, and storage facilities. However, the GNH emphasis on sustainability could restrict growth in this sector. For example, to preserve biodiversity there are restrictions on the use of chemical fertilizers.
Text E — Youth unemployment in Bhutan
The youth unemployment rate for Bhutan in 2021 was 20.9 %. However, youth unemployment in towns was much higher than in rural areas. Approximately 60 % of the total unemployed youth were female.
There is a mismatch between the needs of employers and the skills of young people. Apart from this problem, the private sector requires government assistance in creating job opportunities so that young people can find employment outside of the public sector. Moreover, a lack of finance discourages the youth from entrepreneurship, further reducing their work prospects and the growth of Bhutan’s economy.
Text F — Bhutan’s trade relations with India
Bhutan has a free trade agreement with India, removing all tariffs between the two countries. In 2021–2022, about 80 % of Bhutan’s international trade was with India. India’s top imports from Bhutan include electricity, metals, and cement. Bhutan relies on India for goods such as fuel, cars, and rice. Transactions between the two countries are straightforward, as the central bank of Bhutan ensures the ngultrum (Bhutan’s currency, BTN) is fixed to the rupee (India’s currency, INR) at the exchange rate of 1 BTN = 1 INR.
* aged between 15 and 24
Table 4: Economic data for Bhutan
| 2008 | 2021 | |
|---|---|---|
| Population (total) | 689737 | 782455 |
| Nominal gross domestic product (GDP) (USD million) | 1227.81 | 2539.55 |
| GDP deflator | 143 | 279 |
| GDP growth (annual %) | 4.8 | 4.1 |
| Net income from abroad (USD million) | −34.02 | −155.64 |
| Current account balance (USD million) | −112.48 | −321.53 |
Table 5: Development data for Bhutan
| 2007 | 2022 | |
|---|---|---|
| Life expectancy at birth (years) | 67 | 72 |
| Absolute poverty (% of population living on less than USD 2.15 (2017 PPP) per day) | 5.9 | 0 |
| Gini coefficient | 0.381 | 0.285 |
| People using safe sanitation services (% of population) | 44 | 51 |
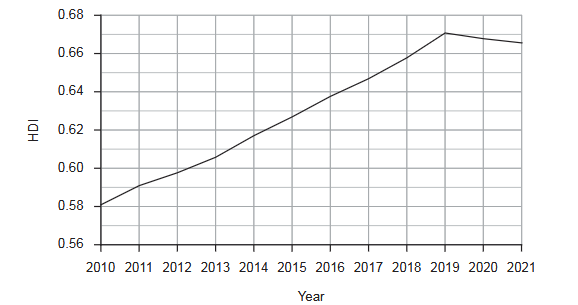
Figure 1: HDI for Bhutan from 2010 to 2021
(a) (i) Define the term economic growth indicated in bold (Text D, paragraph 2). [2]
Show Answer
Economic growth is an increase in an economy’s real GDP or total real output over time.
(a) (ii) Define the term resources indicated in bold (Text D, paragraph 3). [2]
Show Answer
Resources are the factors of production or inputs used to produce goods and services, such as land, labour, capital and entrepreneurship.
(b) (i) Using information from Table 4, calculate Bhutan’s real gross domestic product (GDP) in USD in 2021. [2]
Show Answer
Real GDP is calculated using:
Real GDP = (Nominal GDP ÷ GDP deflator) × 100
\(= \dfrac{2539.55}{279} \times 100\)
Therefore, Bhutan’s real GDP in 2021 was:
USD 910.23 million
(b) (ii) Using information from Table 4, calculate Bhutan’s nominal GDP per capita in USD in 2021. [1]
Show Answer
From Table 4, nominal GDP was USD 2539.55 million and population was 782455 in 2021.
\(\text{Nominal GDP per capita} = \dfrac{2539.55 \times 10^{6}}{782455}\)
Therefore, Bhutan’s nominal GDP per capita in 2021 was:
USD 3245.62
(b) (iii) Using information from Table 4, calculate the change in Bhutan’s nominal gross national income (GNI) in USD between 2008 and 2021. [2]
Show Answer
GNI = GDP + net income from abroad
2021: \(2539.55 + (-155.64) = 2383.91\) million USD
2008: \(1227.81 + (-34.02) = 1193.79\) million USD
Change in GNI:
\(2383.91 – 1193.79 = \mathbf{1190.12}\) million USD
Therefore, Bhutan’s nominal GNI increased by USD 1190.12 million between 2008 and 2021.
(c) Using an aggregate demand and aggregate supply (AD/AS) diagram, explain the likely effect on Bhutan’s real GDP of a large increase in sales of electricity, produced in Bhutan, to India (Text D, paragraph 4). [4]
Show Answer
A large increase in Bhutan’s sales of electricity to India represents an increase in exports.
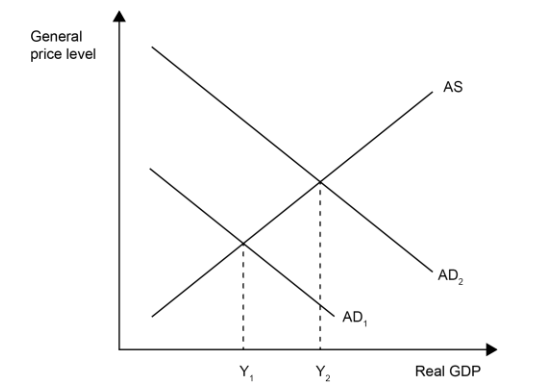
Since exports are a component of aggregate demand, an increase in exports causes aggregate demand (AD) to increase. Therefore, the AD curve shifts rightward, from AD₁ to AD₂.
At the new equilibrium, the level of real output is higher. Therefore, Bhutan’s real GDP increases, from Y₁ to Y₂, assuming other factors remain unchanged.
Thus, increased electricity exports to India are likely to raise Bhutan’s real GDP through higher aggregate expenditure.
(d) Using a demand and supply diagram, explain the likely effect of improved road networks on the price of rice that is sold in Bhutan’s towns (Text D, paragraph 7). [4]
Show Answer
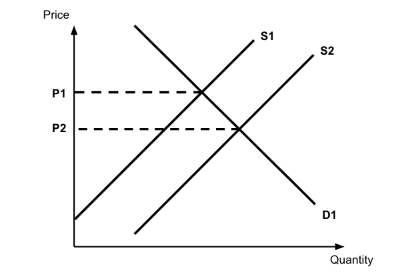
Improved road networks reduce the transport and distribution costs faced by farmers bringing rice to urban markets, and improve the efficiency of moving produce from farms to markets.
This lowers firms’ costs of production and distribution, causing the supply of rice to increase. The supply curve therefore shifts rightward, from S₁ to S₂.
As a result, the equilibrium price of rice falls, from P₁ to P₂, while the equilibrium quantity traded increases.
Therefore, improved road networks are likely to make rice cheaper for consumers in Bhutan’s towns.
(e) Using an exchange rate diagram, explain how the central bank of Bhutan could maintain its fixed exchange rate during a period of falling demand from India for metals and cement produced in Bhutan (Text F). [4]
Show Answer
A fall in India’s demand for Bhutanese metals and cement reduces Bhutan’s exports and therefore reduces the demand for the ngultrum (BTN). This would normally place downward pressure on the currency, causing depreciation.
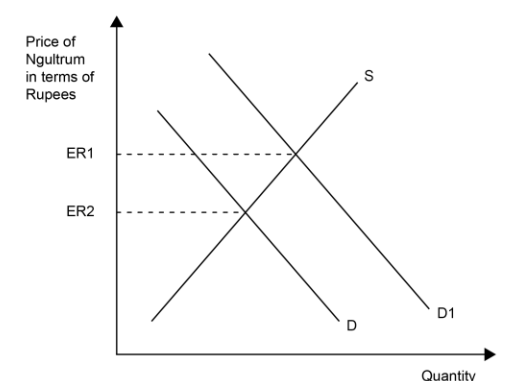
To maintain the fixed exchange rate, the central bank can sell foreign currency reserves and buy ngultrums in the foreign exchange market. This increases demand for the ngultrum and prevents its value from falling below the fixed rate.
Alternatively, the central bank could raise the interest rate, attracting financial capital inflows and increasing demand for the ngultrum.
Thus, central bank intervention can maintain the fixed exchange rate despite the fall in demand for Bhutanese exports.
(f) Using an externalities diagram, explain how increased government investment in education could achieve allocative efficiency in Bhutan’s education market (Text D, paragraph 4). [4]
Show Answer
Education generates positive externalities of consumption, as benefits such as a more productive workforce and improved social outcomes are received by third parties beyond the individual being educated.
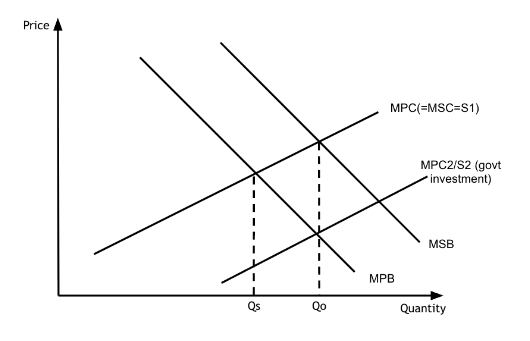
Therefore, the marginal social benefit (MSB) of education exceeds the marginal private benefit (MPB). Left to the free market, output is under-provided at Q1, below the socially optimal quantity Q2, creating a welfare loss.
Increased government investment in education can increase the supply of education, for example by funding more institutions, teachers and resources. This shifts the supply curve rightward and raises output towards the socially optimal level.
At the socially optimal quantity, MSB = MSC, so allocative efficiency is achieved, or the market moves closer towards it.
(g) Using information from the text/data and your knowledge of economics, evaluate the strengths and limitations of Bhutan’s economic development strategy. [15]
Show Answer
Bhutan’s economic development strategy centres on Gross National Happiness (GNH) rather than relying solely on GDP. The strategy combines economic growth with objectives such as income equality, environmental conservation, sustainable development and gender equality. This broad approach has produced several important benefits, although there are also significant limitations.
One strength is the focus on wider measures of economic development. GNH considers factors not fully captured by GDP per capita, including environmental conservation, equality and well-being. There is evidence of improvement in Bhutan’s development indicators: life expectancy rose from 67 years in 2007 to 72 years in 2022, the Gini coefficient fell from 0.381 to 0.285, and absolute poverty fell from 5.9% to 0%. Therefore, the strategy appears to have improved several dimensions of development rather than simply increasing output.
Investment in hydropower and infrastructure is another strength. Hydropower provides renewable electricity and has allowed rural and urban areas to gain access to power. Electricity exports to India generate government revenue that can finance healthcare, education and infrastructure. Such investment raises human and physical capital, potentially increasing productivity and long-run productive capacity.
Government investment in education and healthcare can also improve equity. Education raises human capital and can improve productivity and employment opportunities, while better healthcare improves life expectancy and the quality of the labour force. This supports both growth and development, although the opportunity cost of this spending must be considered, since the same funds cannot be used elsewhere.
There is also an important environmental strength. Around 60% of Bhutan’s territory is protected forest, while hydropower is a renewable energy source. The sustainability tax on tourists generates revenue while supporting conservation. These policies help Bhutan pursue sustainable development rather than growth at the environment’s expense.
However, the emphasis on sustainability can conflict with economic growth. Restrictions on chemical fertilizers, introduced to preserve biodiversity, may limit agricultural productivity, while environmental objectives may also restrict expansion of other industries. This creates an opportunity cost, since faster agricultural or industrial growth could generate employment and income, especially in rural areas.
Bhutan is also highly dependent on India. Around 80% of its international trade is with India, and electricity exports to India are a key revenue source. This makes Bhutan vulnerable to external shocks, and its current account deficit widened from USD 112.48 million in 2008 to USD 321.53 million in 2021. Greater diversification of exports and trading partners would make the strategy more resilient.
Reliance on foreign aid and loans is another limitation. Bhutan has depended on grants and loans from India to finance hydropower projects. Foreign finance can fill a savings gap and enable investment that would otherwise be unaffordable, but loans must eventually be repaid with interest, so excessive borrowing could create debt and balance of payments pressures.
State ownership may also reduce efficiency. Electricity production and distribution are controlled by state-owned enterprises. Although this helps ensure access for vulnerable communities, public-sector control can reduce productive efficiency. Meanwhile, the private sector continues to face high transport costs, a small domestic market and limited access to finance, restricting private-sector job creation.
The strategy has also had mixed results in employment and gender equality. Youth unemployment was 20.9% in 2021, and about 60% of unemployed youth were female. This suggests improvements in education and overall development have not automatically translated into sufficient employment opportunities, particularly for women.
Overall, Bhutan’s strategy has been relatively successful in improving broad measures of economic development. Reduced poverty and inequality, higher life expectancy, wider access to electricity, and investment in education and healthcare all indicate substantial progress. However, the strategy is limited by dependence on India and foreign finance, insufficient private-sector employment, the opportunity cost of government spending, and possible conflicts between environmental sustainability and productivity.
Therefore, the strategy is strongest where GNH objectives complement economic growth, but greater private-sector development, export diversification and employment creation would be needed to sustain long-term development.
Most-appropriate topic codes (CED):