Question
Option A — Freshwater
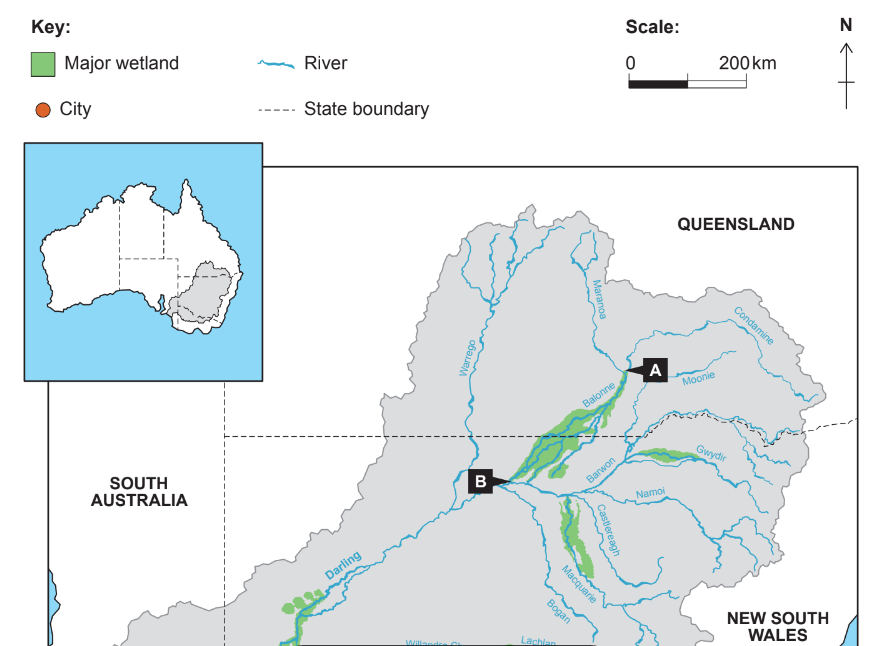
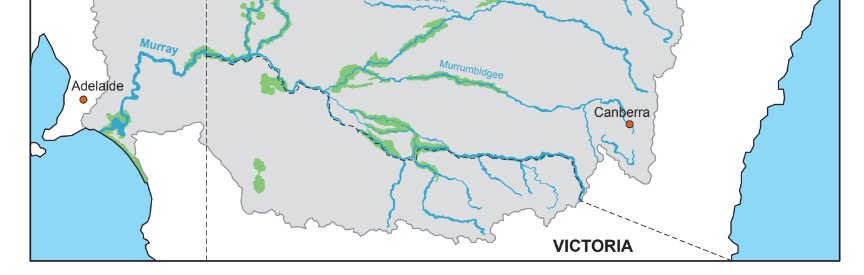
The map shows the major wetland areas within the Murray–Darling river basin in the state of New South Wales in Australia.
Answer the following question.
1. Refer to the map on page 2 of the accompanying resource booklet.
The map shows the major wetland areas within the Murray-Darling river basin in the state of New South Wales in Australia.
(a) (i) State the direction of flow of the Darling River.\([1]\)
(ii) Estimate the length of the wetland area, in kilometres, between \(\mathbf{A}\) and \(\mathbf{B}\).[1]
(b) Outline one benefit of maintaining a wetland area.
(c) Explain one pressure on wetlands from agriculture and one pressure on wetlands from altered water flow.[3+3]
▶️Answer/Explanation
Ans:
a(i) SW
(ii) 280 km. (Allow answers between 260 and 300 km).
(b) Award [1] for the benefit and [1] for explanation.
For example: Wetlands provide a habitat for wildlife [1] so improving the
biodiversity in the area [1].
Other possible benefits include:
• Improve water quality/supply
• Provide flood control
• Pollution filter
• Opportunities for education/research
• Recreational opportunities
• Carbon sink
(c) Award [1] for the pressure and [2] for development/explanation in each case.
Agriculture
For example: Eutrophication [1] can occur when fertilizer applied to farmland
nearby runs off into the water [1] causing algae blooms and a decrease in
water quality/biodiversity [1].
Altered water flow
For example: Wetlands can be drained [1] for development of infrastructure
[1] in order to house a growing population [1].
Other pressures include:
• Draining of wetlands for agriculture
• Irrigation or water abstraction ؘ– lowers water tables
• Drought – lowers water tables
• Tourism and recreation – must be linked to altered water flow
• Dam construction – restricting flow of water into wetlands
Do not double credit if same point used for both parts of the question
Question
The diagram shows the main features of the hydrological cycle.
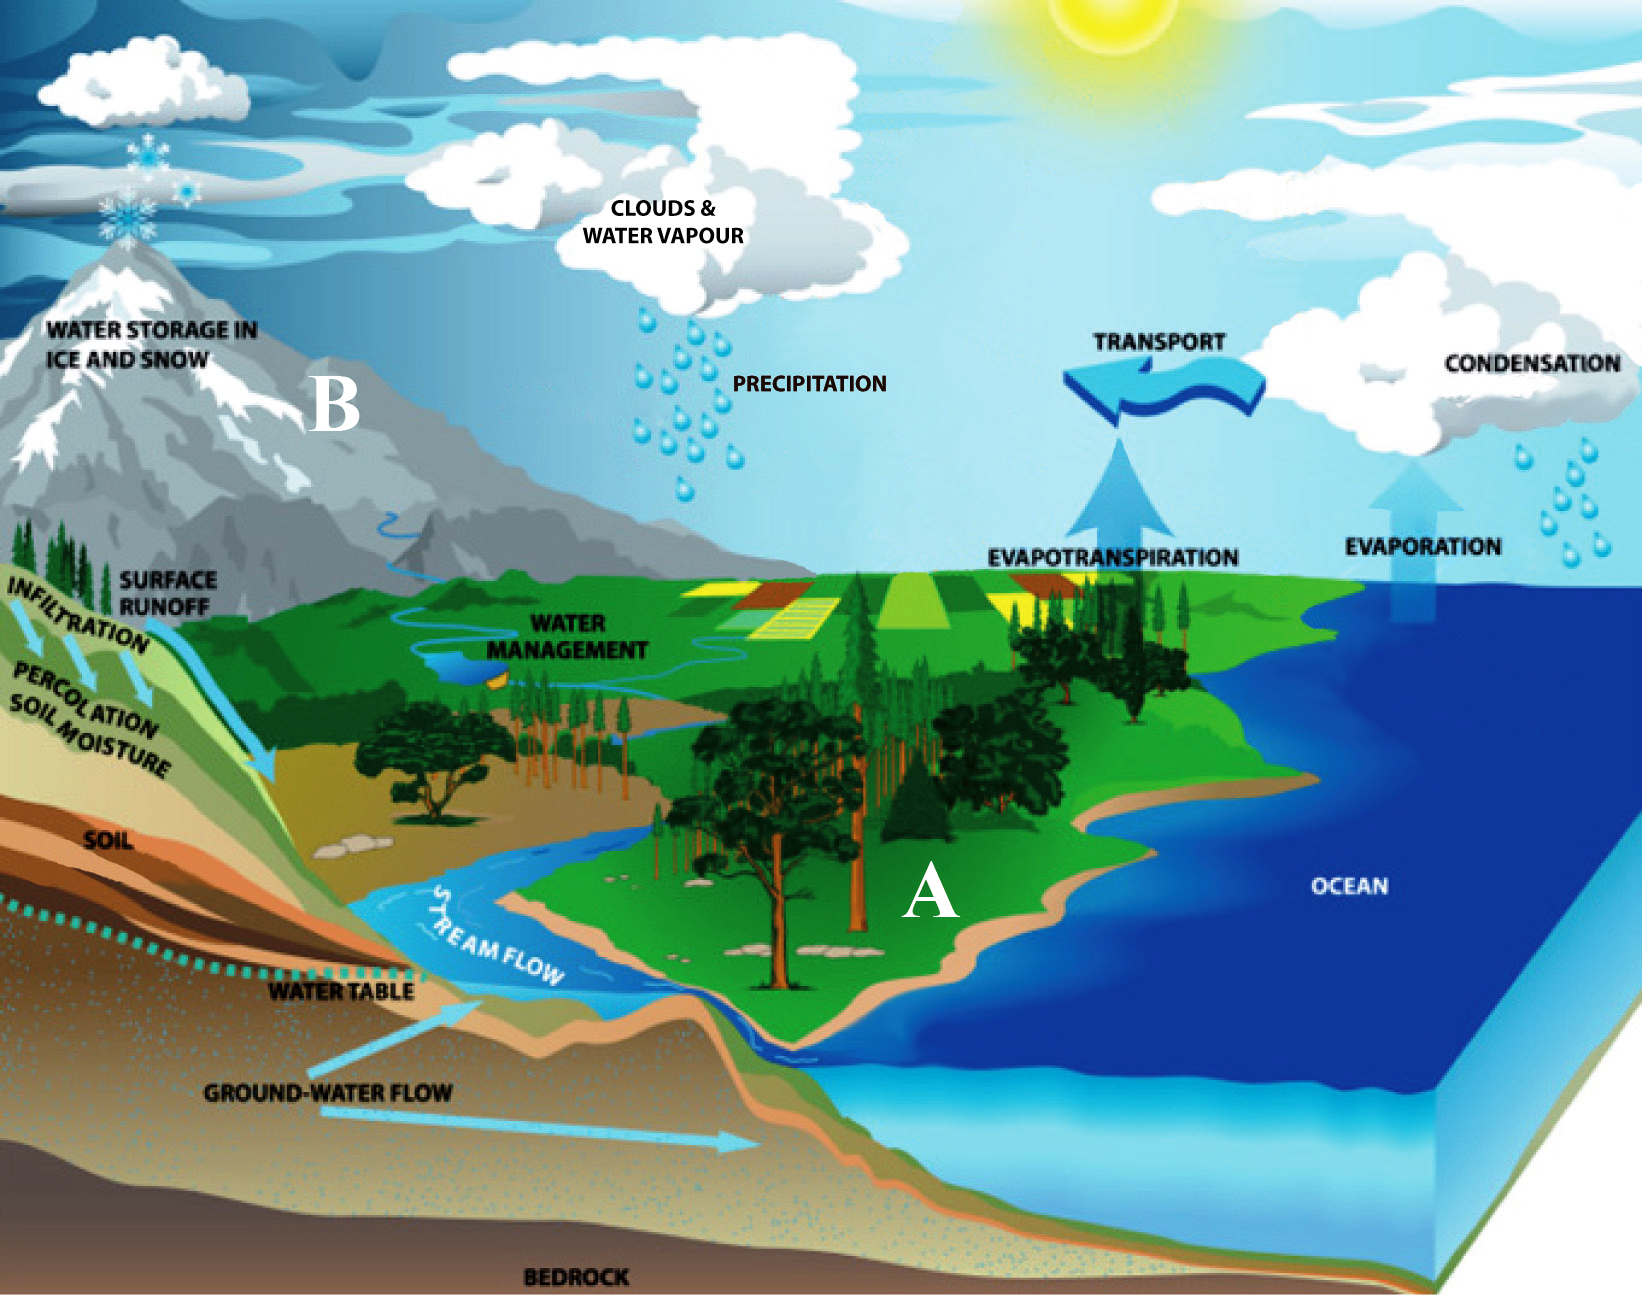
Describe two conditions at point A which would make infiltration rates higher than at point B.[2×2]
Explain the consequences of a decrease in the amount of water stored in ice in the hydrological cycle at any stage.[6]
“Strategies adopted to meet the competing demands for water are not always effective.” Discuss this statement with reference to one named river basin.[10]
▶️Answer/Explanation
Markscheme
Possible answers could include interception by vegetation, slope angle, snow melt, non-frozen ground, soil characteristics (soil porosity, soil infiltration capacity), water content of the soil, antecedent precipitation, intensity of the precipitation or any other logical answer.
Award 1 mark for identifying each factor and a further 1 mark for how it influences infiltration.
Possible consequences may be human and/or physical. The human consequences are likely to be negative: water insecurity, changes in tourism, coastal inundation, environmental refugees. There may be short-term benefits, for example, increased river flow, accessibility to more grazing lands.
Responses may mention arctic ice melt, new shipping routes, new sea floor exploitation, retreating land ice can increase agricultural land area.
Physical consequences could include: rising sea levels caused by ice melt, retreat of glaciers and ice shelves/ice caps caused by global warming, flooding in low-ying areas, drowned features on coastlines (resulting from eustatic changes in sea level) or emergent features (resulting from isostatic rebound).
At least two different consequences must be explained for the award of full marks. Candidates may choose to explain two consequences in depth or more than two in less depth.
Responses will depend on the river basin chosen.
The basin should be named and located (if more than one basin is used, credit should be given to the example which answers the question most effectively). The competing demands should be outlined depending on which basin is named.
The strategies (such as dams, reservoirs, water rationing, water pricing) adopted in the basin to meet the competing demands should be outlined. The successes and, if relevant, failures of the management strategies should be discussed. Discussion on whether the strategies are effective depends on the view of the stakeholder. The best responses may reflect this.
Answers that do not refer to a named river basin, or which focus on one side of the argument, should not move above band D. To access markbands E and F, the strategies should be effectively evaluated.
Marks should be allocated according to the markbands.
Examiners report
Some candidates overcomplicated matters by referring to rock type and permeability when there was no evidence to support this on the diagram, but the concept of infiltration capacity was well understood.
This was generally well answered. Candidates wrote about a range of consequences, notably flooding and sea-level change (though few referred to drowned or emergent coastal landforms that could result from consequent eustatic or isostatic changes). However, some candidates failed to go into detail – that would be alright if they had a large range of consequences.
There were some very good answers which dealt with a named drainage basin. However, some candidates did not identify a basin – nor a strategy – and identified conflicts over access to water, for example, Israel and Palestine. Others wrote about the advantages and disadvantages of large dams – which is relevant – but needs to go further into strategies. Competing demands could also have been explored in more detail as numerous responses did not identify these with specific reference to the chosen basin.
Question
The diagram shows the inputs, outputs, stores and transfers that occur within a drainage basin as an open system.

Identify two transfers and two stores shown in the diagram.[2+2]
Explain three ways in which human activity can reduce the time taken for water to pass through the system.[2+2+2]
Examine how an international conflict has arisen as a result of competing demands for freshwater.[10]
▶️Answer/Explanation
Markscheme
Award 2 marks for the correct identification of two stores (interception, surface water, soil moisture, groundwater, channel) and 2 marks for the correct identification of two transfers (soil infiltration, percolation, overland flow, throughflow, groundwater flow). No marks should be awarded for the identification of evapotranspiration or river enters the sea as a transfer.
Answers depend on the human activity/activities chosen which may lead to land use changes (urbanization, deforestation, agriculture), river channel modifications, drainage systems. Marks should not be allocated to “increased rainfall”.
Award 1 mark for correct identification of a relevant human activity and 1 mark for a valid explanation of how it reduces the time taken for water to pass through the system.
The freshwater water resource involved should be clearly identified and located, as should the countries involved in the water conflict.
Answers should clearly describe the nature of the conflict and explain why it occurs.
The associated problems for each of the countries involved should be examined. Attempts to resolve the conflict can lead to further conflict and this can be credited where relevant.
Answers that refer only to a conflict within a country should not move above band C.
Marks should be awarded according to the markbands.
Examiners report
Knowledge and understanding was good.
Weaker candidates often failed to unpack the term “human activity”. Popular choices were urbanization, deforestation and river channel modifications.
Many answers were based on the USA–Mexico conflict over usage of the River Colorado, but specific details of this (or other chosen examples such as the Nile basin or the Jordan) were often shaky. Some accounts were overly descriptive and insufficiently focused on the details of the conflict. Where candidates wrote about more than one example, the higher-scoring example was credited.
Question
Option A — Freshwater – issues and conflicts
1. The diagram shows the three main sources of freshwater on Earth.
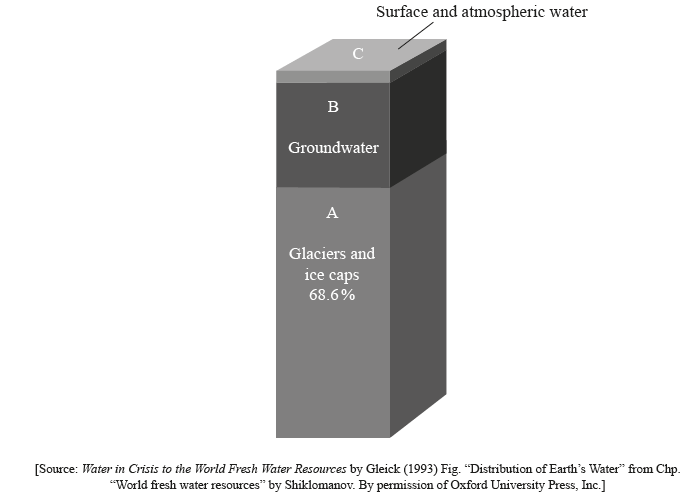
(i) Define the term groundwater.
(ii) Estimate the percentage of groundwater shown on the diagram.[2]
State two major types of natural surface freshwater (other than rivers).[2]
Explain three consequences of a reduction in the volume of ice caps.[6]
Discuss the relative importance of the factors affecting the characteristics of hydrographs.[10]
▶️Answer/Explanation
Markscheme
(i) Water found below the surface of the earth [1 mark].
(ii) Accept answers in the range 25–30 % (inclusive) [1 mark].
Accept lakes, wetlands (marshes or swamps), depression storage/surface storage.
Award [1 mark] for each source identified.
Accept any of the following. In each case, award [1 mark] for a valid consequence and [1 mark] for a valid explanation. For example:
- coastal flooding/inundation [1 mark] due to rising sea levels/more water stored in oceans [1 mark]
- relocation of coastal settlements [1 mark] due to heightened long-term flood risk [1 mark] (but do not credit suggestion that massive flooding occurs “overnight” leading to death and destruction)
- accelerated global warming [1 mark] due to albedo reduction as ice melts [1 mark]
- loss of productive agricultural land [1 mark] due to saline intrusion/contamination of freshwater
- landscape changes as land-based glaciers retreat [1 mark] due to moraine deposition etc [1 mark]
- possible river flooding [1 mark] due to melting of ice caps/glaciers [1 mark].
Credit other valid consequences and explanations.
Credit all content in line with the markbands. Credit unexpected approaches wherever relevant.
One approach would be to look at a single river: temporal variations are based on factors such as precipitation (amount, intensity, type), antecedent rainfall and seasonal changes in vegetation/interception. Another approach is to compare a different river: geology, soils and land-use (urbanization), drainage basin size and shape, relief, all play an important role.
Factors should be linked with characteristics that can include rising limb, falling limb, lag-time and peak discharge. Diagrams should be credited.
Certain domain factors could be identified such as geology (when discussing different basins), or antecedent conditions (when discussing variations in response to two similar sized rainfall events). Urbanization over time is a key factor that can transform hydrographs. Clearly, any evaluation of relative importance is context specific.
At band D, a range of factors should be described that are linked to some recognizable hydrograph characteristics.
At band E there should be either a wider or structured discussion of factors (may compare different basins, as well as considering seasonal changes or urban/rural contrasts) or a viewpoint is argued about the relative importance of factors (but for a more limited range of factors/scenarios).
At band F, expect both elements.
Examiners report
(i/ii) No problems encountered.
These had to be natural and surface, for example, lakes, springs. Too many candidates named oceans, aquifers, reservoirs and were therefore unable to identify a second type of freshwater.
Generally done well although the explanations were sometimes very descriptive rather than backing up the consequence.
There were some very good answers showing that hydrographs and the factors affecting their characteristics are being well taught. There were some good annotated diagrams and terminology was clear. The main weakness was not considering the relative importance of the factors. However, many wrote generalized answers on rivers and showed no understanding of the term hydrographs.