▶️ Answer/Explanation
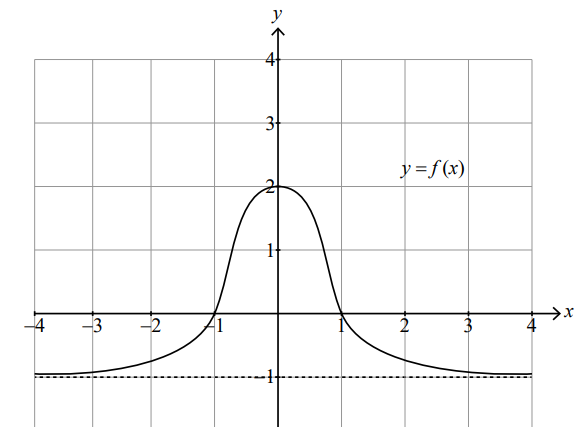
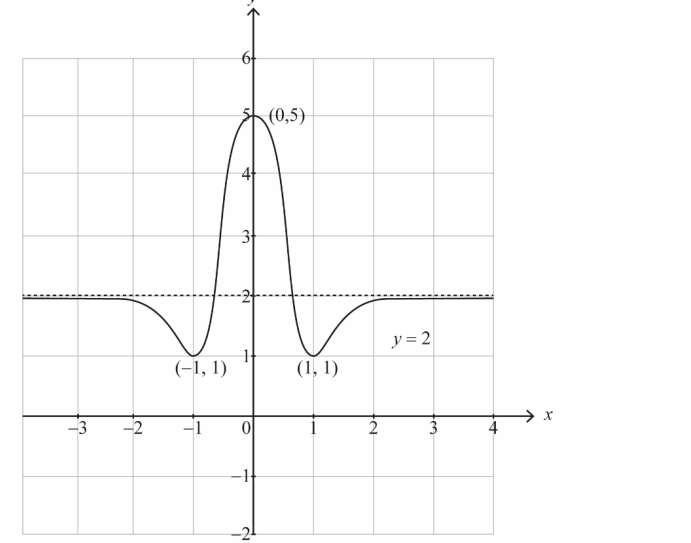
Sketch the graph of \( y = [f(x)]^2 + 1 \):
- No \( y \)-values below 1 (A1).
- Horizontal asymptote at \( y = 2 \), with curve approaching from below as \( x \to \pm \infty \) (A1).
- \( (\pm 1, 1) \) local minima (A1).
- \( (0, 5) \) local maximum (A1).
- Smooth curve and smooth stationary points (A1, N5).
Working:
Analyze \( g(x) = [f(x)]^2 + 1 \):
Horizontal asymptote: As \( x \to \pm \infty \), \( f(x) \to -1 \), so \( [f(x)]^2 \to (-1)^2 = 1 \), \( g(x) \to 1 + 1 = 2 \). Asymptote: \( y = 2 \), approached from below since \( [f(x)]^2 \leq 1 \) when \( f(x) \leq -1 \). (A1)
X-intercepts: \( g(x) = 0 \implies [f(x)]^2 + 1 = 0 \), impossible since \( [f(x)]^2 \geq 0 \). No x-intercepts. Y-intercept: At \( x = 0 \), \( f(0) = 2 \), so \( g(0) = 2^2 + 1 = 5 \), point \( (0, 5) \). (A1)
Extrema: Derivative: \( g'(x) = 2 f(x) f'(x) \). Set \( g'(x) = 0 \): \( f(x) = 0 \) or \( f'(x) = 0 \). At \( x = \pm 1 \), \( f(\pm 1) = 0 \), so \( g(\pm 1) = [f(\pm 1)]^2 + 1 = 0 + 1 = 1 \), points \( (\pm 1, 1) \). Since \( [f(x)]^2 \geq 0 \), \( g(x) \geq 1 \), confirming minima. (A1)
Maximum: At \( x = 0 \), \( g(0) = 5 \). Since \( f(x) \) peaks near \( x = 0 \) with \( f(0) = 2 \), and \( g(x) = [f(x)]^2 + 1 \), the point \( (0, 5) \) is a maximum, as \( g(x) \leq 5 \) elsewhere (e.g., at \( x = \pm 1 \), \( g(x) = 1 \)). (A1)
Shape: Graph is smooth, with minima at \( (\pm 1, 1) \), maximum at \( (0, 5) \), and approaches \( y = 2 \) from below, ensuring no \( y \)-values below 1. (A1)
[5 marks]
Total [5 marks]
Question
The graph of \(y = (x – 1)\sin x\) , for \(0 \le x \le \frac{{5\pi }}{2}\) , is shown below.
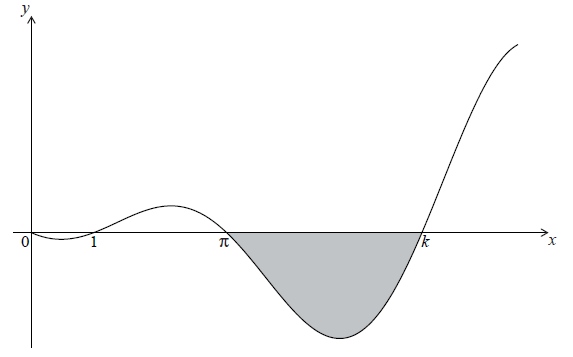
The graph has \(x\)-intercepts at \(0\), \(1\), \( \pi\) and \(k\) .
Find k .[2]
The shaded region is rotated \(360^\circ \) about the x-axis. Let V be the volume of the solid formed.
Write down an expression for V .[3]
The shaded region is rotated \(360^\circ \) about the x-axis. Let V be the volume of the solid formed.
Find V .[2]
Answer/Explanation
Markscheme
evidence of valid approach (M1)
e.g. \(y = 0\) , \(\sin x = 0\)
\(2\pi = 6.283185 \ldots \)
\(k = 6.28\) A1 N2
[2 marks]
attempt to substitute either limits or the function into formula (M1)
(accept absence of \({\rm{d}}x\) )
e.g. \(V = \pi \int_\pi ^k {{{(f(x))}^2}{\rm{d}}x} \) , \(\pi \int {{{((x – 1)\sin x)}^2}} \) , \(\pi \int_\pi ^{6.28 \ldots } {{y^2}{\rm{d}}x} \)
correct expression A2 N3
e.g. \(\pi \int_\pi ^{6.28} {{{(x – 1)}^2}{{\sin }^2}x{\rm{d}}x} \) , \(\pi \int_\pi ^{2\pi } {{{((x – 1)\sin x)}^2}{\rm{d}}x} \)
[3 marks]
\(V = 69.60192562 \ldots \)
\(V = 69.6\) A2 N2
[2 marks]
Question
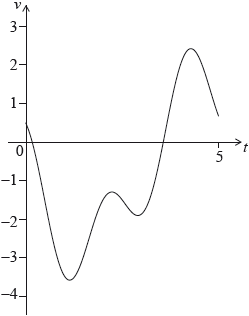
A particle P moves along a straight line so that its velocity, \(v\,{\text{m}}{{\text{s}}^{ – 1}}\), after \(t\) seconds, is given by \(v = \cos 3t – 2\sin t – 0.5\), for \(0 \leqslant t \leqslant 5\). The initial displacement of P from a fixed point O is 4 metres.
The following sketch shows the graph of \(v\).
Find the displacement of P from O after 5 seconds.
Find when P is first at rest.
Write down the number of times P changes direction.
Find the acceleration of P after 3 seconds.
Find the maximum speed of P.
Answer/Explanation
Markscheme
METHOD 1
recognizing \(s = \int v \) (M1)
recognizing displacement of P in first 5 seconds (seen anywhere) A1
(accept missing \({\text{d}}t\))
eg\(\,\,\,\,\,\)\(\int_0^5 {v{\text{d}}t,{\text{ }} – 3.71591} \)
valid approach to find total displacement (M1)
eg\(\,\,\,\,\,\)\(4 + ( – 3.7159),{\text{ }}s = 4 + \int_0^5 v \)
0.284086
0.284 (m) A2 N3
METHOD 2
recognizing \(s = \int v \) (M1)
correct integration A1
eg\(\,\,\,\,\,\)\(\frac{1}{3}\sin 3t + 2\cos t – \frac{t}{2} + c\) (do not penalize missing “\(c\)”)
attempt to find \(c\) (M1)
eg\(\,\,\,\,\,\)\(4 = \frac{1}{3}\sin (0) + 2\cos (0)–\frac{0}{2} + c,{\text{ }}4 = \frac{1}{3}\sin 3t + 2\cos t – \frac{t}{2} + c,{\text{ }}2 + c = 4\)
attempt to substitute \(t = 5\) into their expression with \(c\) (M1)
eg\(\,\,\,\,\,\)\(s(5),{\text{ }}\frac{1}{3}\sin (15) + 2\cos (5)5–\frac{5}{2} + 2\)
0.284086
0.284 (m) A1 N3
[5 marks]
recognizing that at rest, \(v = 0\) (M1)
\(t = 0.179900\)
\(t = 0.180{\text{ (secs)}}\) A1 N2
[2 marks]
recognizing when change of direction occurs (M1)
eg\(\,\,\,\,\,\)\(v\) crosses \(t\) axis
2 (times) A1 N2
[2 marks]
acceleration is \({v’}\) (seen anywhere) (M1)
eg\(\,\,\,\,\,\)\(v'(3)\)
0.743631
\(0.744{\text{ }}({\text{m}}{{\text{s}}^{ – 2}})\) A1 N2
[2 marks]
valid approach involving max or min of \(v\) (M1)
eg\(\,\,\,\,\,\)\(v\prime = 0,{\text{ }}a = 0\), graph
one correct co-ordinate for min (A1)
eg\(\,\,\,\,\,\)\(1.14102,{\text{ }}-3.27876\)
\(3.28{\text{ }}({\text{m}}{{\text{s}}^{ – 1}})\) A1 N2
[3 marks]
Question
Let g(x) = −(x − 1)2 + 5.
Let f(x) = x2. The following diagram shows part of the graph of f.

The graph of g intersects the graph of f at x = −1 and x = 2.
Write down the coordinates of the vertex of the graph of g.
On the grid above, sketch the graph of g for −2 ≤ x ≤ 4.
Find the area of the region enclosed by the graphs of f and g.
Answer/Explanation
Markscheme
(1,5) (exact) A1 N1
[1 mark]
 A1A1A1 N3
Note: The shape must be a concave-down parabola.
Only if the shape is correct, award the following for points in circles:
A1 for vertex,
A1 for correct intersection points,
A1 for correct endpoints.
[3 marks]
integrating and subtracting functions (in any order) (M1)
eg \(\int {f – g} \)
correct substitution of limits or functions (accept missing dx, but do not accept any errors, including extra bits) (A1)
eg \(\int_{ – 1}^2 {g – f,\,\,\int { – {{\left( {x – 1} \right)}^2}} } + 5 – {x^2}\)
area = 9 (exact) A1 N2
[3 marks]