Home / IB Mathematics SL 4.2 Understanding of box and whisker diagrams AA SL Paper 1- Exam Style Questions

IB Mathematics SL 4.2 Understanding of box and whisker diagrams AA SL Paper 1- Exam Style Questions- New Syllabus

Question

The scores achieved by \(80\) participants in a golf tournament are summarized in the box and whisker diagram below.
(a) Determine the interquartile range of the dataset.
(b) Calculate the number of golfers who achieved a score between \(70\) and \(74\).

Most-appropriate topic codes (IB Math AA):

SL 4.2: Presentation of data; box and whisker diagrams
SL 4.3: Measures of dispersion (interquartile range)
▶️ Answer/Explanation
Detailed solution

(a)
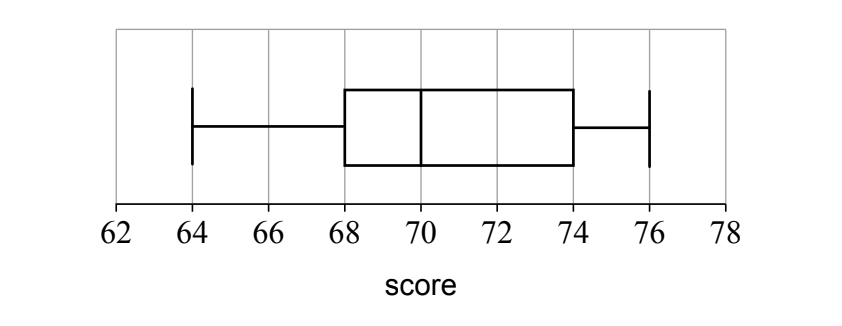
From the diagram, the lower quartile (\(Q_1\)) is \(68\) and the upper quartile (\(Q_3\)) is \(74\).
The interquartile range (IQR) is:
\(IQR = Q_3 – Q_1 = 74 – 68 = 6\)

(b)
The range \(70\) to \(74\) corresponds to the data between the median (\(70\)) and the upper quartile (\(74\)).
This section represents \(25\%\) of the data.
Number of golfers = \(0.25 \times 80 = 20\)

Leave a Reply

Scroll to Top