Question
(ii) State the coordinates of point \( P \).
- the vertical asymptote;
- the horizontal asymptote.
Most-appropriate topic codes (Mathematics: analysis and approaches guide):
• SL 5.8: Local maximum and minimum points; optimization — Part b
• SL 2.8: Rational functions of the form \( f(x) = \frac{ax+b}{cx+d} \) and their graphs; vertical and horizontal asymptotes — Part c, e
▶️ Answer/Explanation
(a)
Method 1 (Finding inverse directly):
Let \( y = f(x) = \frac{2-2x}{x+2} \). Swap \( x \) and \( y \): \( x = \frac{2-2y}{y+2} \).
Cross-multiply: \( x(y+2) = 2 – 2y \Rightarrow xy + 2x = 2 – 2y \).
Group \( y \)-terms: \( xy + 2y = 2 – 2x \Rightarrow y(x+2) = 2 – 2x \).
Thus \( y = \frac{2-2x}{x+2} \), so \( f^{-1}(x) = \frac{2-2x}{x+2} = f(x) \).
\( f^{-1}(x) = f(x) \).
(b)
Since \( f \) is self-inverse, its graph is symmetric about the line \( y = x \). The point on \( y = f(x) \) closest to the origin must lie on the line \( y = x \) (by symmetry).
Set \( f(k) = k \): \( \frac{2-2k}{k+2} = k \Rightarrow 2 – 2k = k(k+2) \Rightarrow 2 – 2k = k^2 + 2k \).
Rearrange: \( k^2 + 4k – 2 = 0 \).
Solve: \( k = \frac{-4 \pm \sqrt{16 + 8}}{2} = \frac{-4 \pm \sqrt{24}}{2} = \frac{-4 \pm 2\sqrt{6}}{2} = -2 \pm \sqrt{6} \).
Numerically: \( -2 + \sqrt{6} \approx 0.4495 \) and \( -2 – \sqrt{6} \approx -4.4495 \).
Choose the point closest to the origin (both lie on \( y=x \), but \( (-4.4495,-4.4495) \) is farther).
Thus \( k \approx 0.449 \).
Coordinates: \( P \approx (0.449, 0.449) \).
(i) \( k \approx 0.449 \); (ii) \( P \approx (0.449, 0.449) \).
(c)
For \( g(x) = \frac{2-3x}{cx+d} \):
(i) Vertical asymptote occurs where denominator is zero: \( cx + d = 0 \Rightarrow x = -\frac{d}{c} \).
(ii) Horizontal asymptote as \( x \to \pm \infty \): \( g(x) \to -\frac{3}{c} \).
(i) \( x = -\frac{d}{c} \); (ii) \( y = -\frac{3}{c} \).
(d)
If \( g^{-1}(x) = g(x) \), then the graph of \( g \) is symmetric about \( y = x \). For a rational function \( \frac{ax+b}{cx+d} \), self-inverse implies the asymptotes are symmetric about \( y = x \), which requires the vertical and horizontal asymptotes to be negatives of each other: \( -\frac{d}{c} = -\left( -\frac{3}{c} \right) \) or directly comparing formulas gives \( d = 3 \).
\( d = 3 \).
(e)
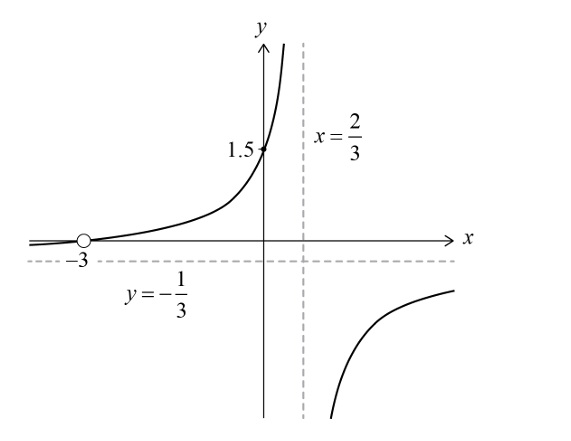
When \( c = 1 \) and \( d = 3 \), \( g(x) = \frac{2-3x}{x+3} \). Then \( \frac{1}{g(x)} = \frac{x+3}{2-3x} \).
• Vertical asymptote: denominator zero when \( 2-3x = 0 \Rightarrow x = \frac{2}{3} \).
• Horizontal asymptote: as \( x \to \pm \infty \), \( \frac{1}{g(x)} \to -\frac{1}{3} \).
• \( x \)-intercept: \( \frac{x+3}{2-3x} = 0 \Rightarrow x+3=0 \Rightarrow x = -3 \).
• \( y \)-intercept: \( x=0 \Rightarrow y = \frac{3}{2} = 1.5 \).
The graph consists of two branches in opposite quadrants, approaching the asymptotes. Show asymptotes \( x = \frac{2}{3} \) (vertical) and \( y = -\frac{1}{3} \) (horizontal), intercepts at \( (-3,0) \) and \( (0,1.5) \).