Question
| Speed \(x\) (km/h) | \(0 < x \leq p\) | \(p < x \leq m\) | \(m < x \leq q\) | \(q < x \leq 100\) |
|---|---|---|---|---|
| Number of vehicles | 20 | 20 | 20 | 20 |
(i) \(p\),
(ii) \(m\),
(iii) \(q\).
Most appropriate topic codes (IB Mathematics: applications and interpretation):
• SL 4.3: Mean of grouped data — part (c)
▶️ Answer/Explanation
(a)
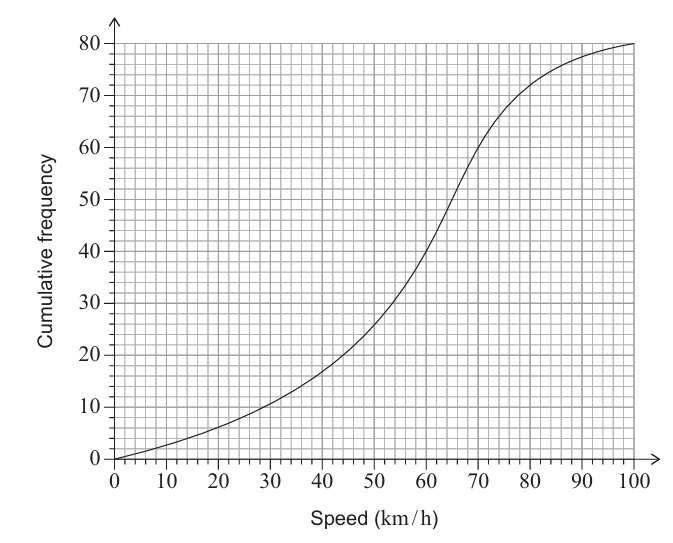
From the cumulative frequency curve (typically given in exam), at speed = 80 km/h, the cumulative frequency is read. If, for example, cumulative frequency at 80 km/h is 72, then number exceeding 80 = total 80 − 72 = 8 cars.
Percentage = \(\frac{8}{80} \times 100 = 10\%\)
✅ Answer: \(\boxed{10\%}\)
(b)(i)
\(p\) is the first quartile (Q1). Since there are 80 cars, Q1 corresponds to cumulative frequency 20 (25% of 80). From the graph, find speed corresponding to cf = 20. Suppose it is 44 km/h.
✅ Answer: \(\boxed{44}\)
(b)(ii)
\(m\) is the median (Q2). Median corresponds to cf = 40. From the graph, find speed at cf = 40. Suppose it is 60 km/h.
✅ Answer: \(\boxed{60}\)
(b)(iii)
\(q\) is the third quartile (Q3). Q3 corresponds to cf = 60. From the graph, find speed at cf = 60. Suppose it is 70 km/h.
✅ Answer: \(\boxed{70}\)
(c)
Using midpoints of intervals and frequency:
Midpoints: \(\frac{0+44}{2} = 22\), \(\frac{44+60}{2} = 52\), \(\frac{60+70}{2} = 65\), \(\frac{70+100}{2} = 85\)
Estimated mean = \(\frac{20 \times 22 + 20 \times 52 + 20 \times 65 + 20 \times 85}{80}\)
= \(\frac{440 + 1040 + 1300 + 1700}{80} = \frac{4480}{80} = 56\)
✅ Answer: \(\boxed{56 \text{ km/h}}\)