IB Mathematics SL 4.2 Presentation of data AI SL Paper 2 - Exam Style Questions - New Syllabus
Question


| Book | A | B | C | D | E | F | G | H |
|---|---|---|---|---|---|---|---|---|
| Number of pages (\(n\)) | 4215 | 863 | 585 | 1225 | 366 | 209 | 624 | 281 |
| Top 50 rating (\(t\)) | 1 | 2 | 5 | 7 | 13 | 22 | 40 | 44 |
| Book | A | B | C | D | E | F | G | H |
|---|---|---|---|---|---|---|---|---|
| Rank – Number of pages | ||||||||
| Rank – Top 50 Rating |
(ii) Interpret your result. [3]
▶️ Answer/Explanation
(a) Sampling method: Quota sampling. A1
(b) Median from boxplot: \(\boxed{10\text{ hours}}\). A1
(c) From the diagram \(Q_1=7,\;Q_3=15\).
\(\text{IQR}=Q_3-Q_1=15-7=\boxed{8\text{ hours}}\). M1 A1
(d) Upper fence \(=Q_3+1.5\times\text{IQR}=15+1.5(8)=27\).
Liam’s time is \(25\text{ h}\) and \(25<27\), so it is not an outlier. Emma is correct. M1 A1 R1 A1
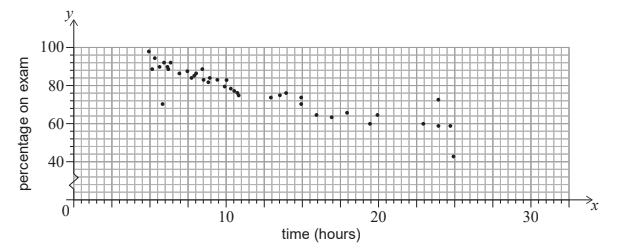
(e) Negative correlation. A1
(f) Substitute \(x=1.5\) into \(y=-1.54x+98.8\):
\(y=-1.54(1.5)+98.8=-2.31+98.8=\boxed{96.49\%\ (\approx 96.5\%)}\). M1 A1
(g) Not valid; \(1.5\) hours is outside the given data range (extrapolation). A1 R1
(h) Ranks (as per exam convention): For “Number of pages”, rank \(1\) = largest number of pages; for “Top 50 rating”, rank \(1\) = best (smallest \(t\)).
| Book | A | B | C | D | E | F | G | H |
|---|---|---|---|---|---|---|---|---|
| Rank – Number of pages | 1 | 3 | 5 | 2 | 6 | 8 | 4 | 7 |
| Rank – Top 50 Rating | 1 | 2 | 3 | 4 | 5 | 6 | 7 | 8 |
(i) Spearman’s rank correlation coefficient. Let \(d=\text{(rank pages)}-\text{(rank rating)}\) and \(n=8\).
| Book | Rank(pages) | Rank(rating) | \(d\) | \(d^2\) |
|---|---|---|---|---|
| A | 1 | 1 | 0 | 0 |
| B | 3 | 2 | 1 | 1 |
| C | 5 | 3 | 2 | 4 |
| D | 2 | 4 | -2 | 4 |
| E | 6 | 5 | 1 | 1 |
| F | 8 | 6 | 2 | 4 |
| G | 4 | 7 | -3 | 9 |
| H | 7 | 8 | -1 | 1 |
| \(\sum d^2\) | 24 | |||
\[ r_s \;=\; 1 – \frac{6(24)}{8(8^2-1)} \;=\; 1 – \frac{144}{8\cdot63} \;=\; 1 – \frac{144}{504} \;=\; 1 – \frac{2}{7} \;=\; \boxed{\frac{5}{7}\ \approx\ 0.714}. \] M1 A1
