Home / IB Mathematics SL 4.6 Use of Venn diagrams, tree diagrams AI SL Paper 2 – Exam Style Questions

IB Mathematics SL 4.6 Use of Venn diagrams, tree diagrams AI SL Paper 2 - Exam Style Questions - New Syllabus

Question 

A Clinic is testing patients for a certain disease. This disease occurs in \(5\%\) of the population.
They test every patient who comes to the centre on a particular day.
(a) State the sampling method being used. [1]
It is intended that if a patient has the disease, they test “positive”, and if a patient does not have the disease, they test “negative”.
However, the tests are not perfect: \(99\%\) of people who have the disease test positive. Also, \(2\%\) of people who do not have the disease test positive.
The tree diagram shows some of this information.

(b) Write down the value of

(i) \(a\).   (ii) \(b\).   (iii) \(c\).   (iv) \(d\). [4]

(c) Use the tree diagram to find the probability that a randomly selected patient

(i) will not have the disease and will test positive.
(ii) will test negative.
(iii) has the disease given that they tested negative. [8]
(d) The Clinic finds the actual number of positive results in their sample is different from that predicted by the tree diagram. Explain why this might be the case. [1]

The staff also reviewed the care received by all visiting patients on a randomly chosen day. All patients received at least one of these services: medical tests (M), were seen by a nurse (N), or were seen by a doctor (D). It was found that:

  • \(78\) had medical tests;
  • \(45\) were seen by a nurse;
  • \(30\) were seen by a doctor;
  • \(9\) had medical tests and were seen by a doctor and a nurse;
  • \(18\) had medical tests and were seen by a doctor but were not seen by a nurse;
  • \(11\) were seen by a nurse and had medical tests but were not seen by a doctor;
  • \(2\) were seen by a doctor without being seen by a nurse and without having medical tests.
(e) Draw a Venn diagram to illustrate this information, placing all relevant information on the diagram. [3]
(f) Find the total number of patients who visited the centre during this day. [2]
▶️ Answer/Explanation
Markscheme

(a) Sampling method: Convenience sampling (they test everyone who attends on that day). A1

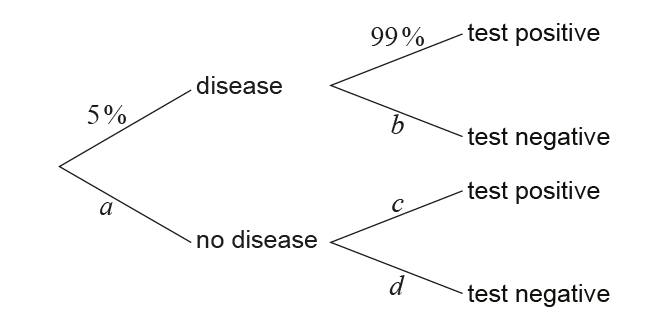
(b) Using the given test characteristics:

(i) \(a = 95\%\) (no disease). A1
(ii) \(b = 1\%\) (test negative given disease). A1
(iii) \(c = 2\%\) (test positive given no disease). A1
(iv) \(d = 98\%\) (test negative given no disease). A1

(c)

(i) \(P(\text{no disease and positive})=P(\text{no disease})\cdot P(+\mid \text{no disease})\) \[ =0.95\times 0.02=\boxed{0.019}. \] M1 A1

(ii) \(P(\text{negative})=P(\text{dis})P(-\mid\text{dis})+P(\text{no dis})P(-\mid\text{no dis})\) \[ =0.05\times 0.01 + 0.95\times 0.98 =0.0005+0.931= \boxed{0.9315\ (\approx 0.932)}. \] M1 M1 A1

(iii) \(P(\text{dis}\mid -)=\dfrac{P(\text{dis and } -)}{P(-)}= \dfrac{0.05\times 0.01}{0.05\times 0.01+0.95\times 0.98}\) \[ =\frac{0.0005}{0.9315} \approx \boxed{0.000537}\quad (\text{or }0.000536\text{ if }0.932\text{ used}). \] M1 A1 A1

(d) Possible reason(s): the sample on that day may not be representative / not randomly selected, and observed frequencies will not usually match model expectations exactly due to sampling variability. A1

(e) Fill the Venn regions (M, N, D) using the totals and intersections:

Triple intersection \(M\cap N\cap D=9\);
\(M\cap D\) only \(=18\); \(M\cap N\) only \(=11\); \(N\cap D\) only \(=1\);
Only \(M=78-(9+18+11)=\mathbf{40}\); Only \(N=45-(9+11+1)=\mathbf{24}\); Only \(D=\mathbf{2}\).

RegionCount
Only M40
Only N24
Only D2
M∩N (no D)11
M∩D (no N)18
N∩D (no M)1
M∩N∩D9

A1 A1 A1

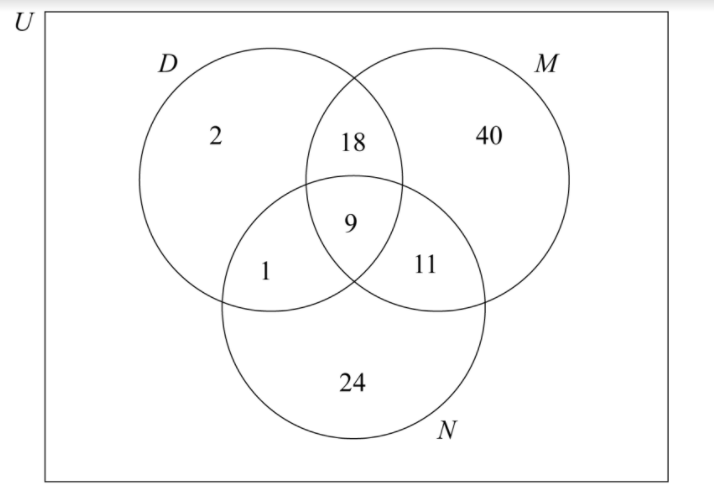
(f) Total patients \(=\) sum of all disjoint regions: \[ 40+24+2+18+1+11+9=\boxed{105}. \] M1 A1

Total Marks: 19
Scroll to Top