Question 4. [Maximum mark: 13]
The stopping distances for bicycles travelling at 20 km h-1 are assumed to follow a normal distribution with mean 6.76 m and standard deviation 0.12 m.
a. Under this assumption, find, correct to four decimal places, the probability that a bicycle chosen at random travelling at 20 km h-1 manages to stop
(i) in less than 6.5 m.
(ii) in more than 7 m. [3]
1000 randomly selected bicycles are tested and their stopping distances when travelling at 20 km h-1 are measured.
b. Find, correct to four significant figures, the expected number of bicycles tested that stop between
(ii)6.5 m and 6.75 m.
(ii) 6.75 m and 7 m. [3]
The measured stopping distances of the 1000 bicycles are given in the table.

It is decided to perform a χ 2 goodness of fit test at the 5 % level of significance to decide whether the stopping distances of bicycles travelling at 20 km h-1 can be modelled by a normal distribution with mean 6.76 m and standard deviation 0.12 m.
a. State the null and alternative hypotheses. [2]
b. Find the p-value for the test. [3]
c. State the conclusion of the test. Give a reason for your answer. [2]
Answer/Explanation
(a) (i) \( P(X<6.5) 0.0151\)
(ii) 0.0228
(b)(i) multiplying their probability by 1000
451.7
(ii) 510.5
(c)H0: stopping distances can be modelled by N(6.76,0.122)
H1: stopping distances can not be modelled by N(6.76,0.122)
(d) 15.1 or 22.8 seen 0.0727 (0.0756542…,7.27%)
(e) \(0.05< 0.0727\) there is insufficient evidence to reject H0 (or accept H0)
Question
Emlyn plays many games of basketball for his school team. The number of minutes he plays in each game follows a normal distribution with mean m minutes.
In any game there is a 30 % chance he will play less than 13.6 minutes.
Sketch a diagram to represent this information. [2]
In any game there is a 70 % chance he will play less than 17.8 minutes.
b Show that m = 15.7 . [2]
The standard deviation of the number of minutes Emlyn plays in any game is 4.
c Find the probability that Emlyn
plays between 13 minutes and 18 minutes in a game;
plays more than 20 minutes in a game. [4]There is a 60 % chance Emlyn plays less than x minutes in a game.
d Find the value of x . [2]
Emlyn will play in two basketball games today.
e Find the probability he plays between 13 minutes and 18 minutes in one game and more than 20 minutes in the other game. [3]
Emlyn and his teammate Johan each practise shooting the basketball multiple times from a point X . A record of their performance over the weekend is shown in the table below.
| Emlyn | Johan |
Saturday | 42 successful shots from 70 attempts | 16 successful shots from 30 attempts |
Sunday | 27 successful shots from 32 attempts | 51 successful shots from 68 attempts |
On Monday, Emlyn and Johan will practise and each will shoot 200 times from point X .
f Find the expected number of successful shots Emlyn will make on Monday, based on the results from Saturday and Sunday. [2]
Emlyn claims the results from Saturday and Sunday show that his expected number of successful shots will be more than Johan’s.
g Determine if Emlyn’s claim is correct. Justify your reasoning. [2]
Answer/Explanation
Ans:
(a) 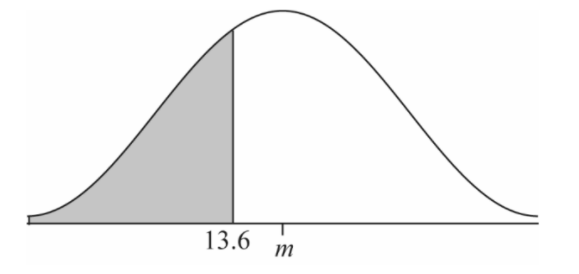
(b) P (T > 17.8) = 0.3
OR
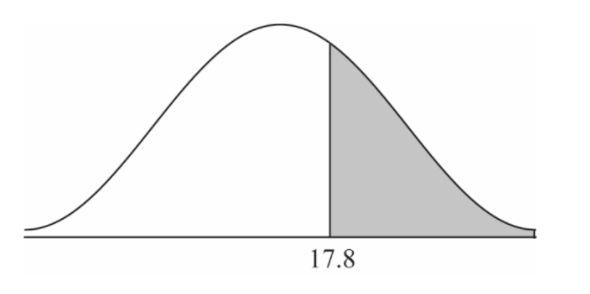

=15.7
(c)
(i) P (13 ≤ T≤ 18)
OR
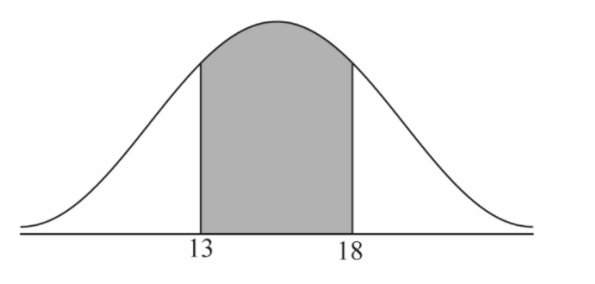
0.468 (46.8%, 0.467516…. )
(ii) P ( T ≥ 20)
OR
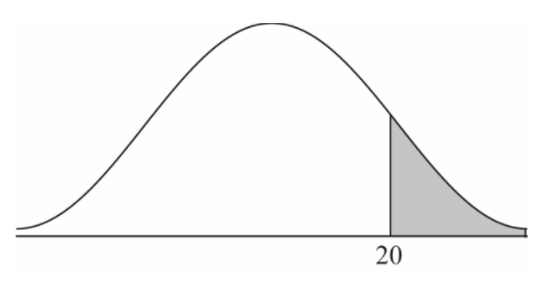
0.141 (14.1%, 0.141187….. )
(d) P ( T< t ) = 0.6
OR
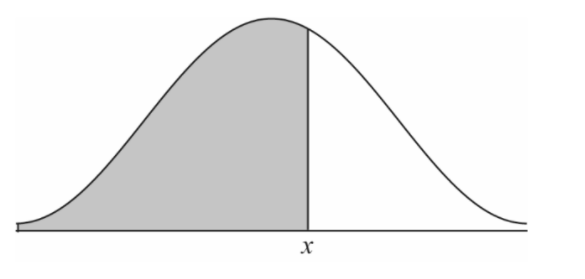
16.7 (16.7133…)
(e)
(0.467516…×0.141187….×2)
OR
(0.141187….×0.467516…..×)0.132
(13.2%, 0.132014…)
(f)
\(\frac{69}{102}\times 200\)
135 (135.294…)
Question
A group of candidates sat a Chemistry examination and a Physics examination. The candidates’ marks in the Chemistry examination are normally distributed with a mean of \(60\) and a standard deviation of \(12\).
Draw a diagram that shows this information.[2]
Write down the probability that a randomly chosen candidate who sat the Chemistry examination scored at most 60 marks.[1]
Hee Jin scored 80 marks in the Chemistry examination.
Find the probability that a randomly chosen candidate who sat the Chemistry examination scored more than Hee Jin.[2]
The candidates’ marks in the Physics examination are normally distributed with a mean of \(63\) and a standard deviation of \(10\). Hee Jin also scored \(80\) marks in the Physics examination.
Find the probability that a randomly chosen candidate who sat the Physics examination scored less than Hee Jin.[2]
The candidates’ marks in the Physics examination are normally distributed with a mean of \(63\) and a standard deviation of \(10\). Hee Jin also scored \(80\) marks in the Physics examination.
Determine whether Hee Jin’s Physics mark, compared to the other candidates, is better than her mark in Chemistry. Give a reason for your answer.[2]
To obtain a “grade A” a candidate must be in the top \(10\% \) of the candidates who sat the Physics examination.
Find the minimum possible mark to obtain a “grade A”. Give your answer correct to the nearest integer.[3]
Answer/Explanation
Markscheme
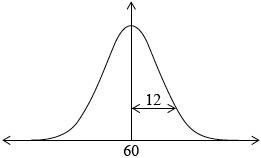 (A1)(A1)
Notes: Award (A1) for rough sketch of normal curve centred at \(60\), (A1) for some indication of \(12\) as the standard deviation eg, as diagram, or with \(72\) and \(48\) shown on the horizontal axis in appropriate places, or for \(96\) and \(24\) shown on the horizontal axis in appropriate places.[2 marks]
\(0.5 \left( {\frac{1}{2},{\text{ 50% }}} \right)\) (A1)
Note: Accept only the exact answer.[1 mark]
\(0.0478{\text{ }} (0.0477903…)\) (G2)
Note: Award (G1) for \(0.952209…\), award (M1)(G0) for diagram with correct area shown but incorrect answer.[2 marks]
\(0.955 {\text{ }} (0.955434…)\) (G2)
Note: Award (G1) for \(0.044565…\), award (M1)(G0) for diagram with correct area shown but incorrect answer.[2 marks]
\(0.0446 < 0.0478\) (R1)
Notes: Award (R1) for correct comparison seen. Accept alternative methods, for example, \(1–\) (their answer to part (c)) used in comparison or a comparison based on \(z\) scores.
the Physics result is better (A1)(ft)
Notes: Do not award (R0)(A1). Follow through from their answers to part (c) and part (d).[2 marks]
\(76\) (G3)
Notes: Award (G1) for \(75.8155…\), award (G2) for \(75\).
Award (M1)(G0) for diagram with correct area shown but incorrect answer.[3 marks]
Question
Daniel grows apples and chooses at random a sample of 100 apples from his harvest.
He measures the diameters of the apples to the nearest cm. The following table shows the distribution of the diameters.

Using your graphic display calculator, write down the value of
(i) the mean of the diameters in this sample;
(ii) the standard deviation of the diameters in this sample.[3]
Daniel assumes that the diameters of all of the apples from his harvest are normally distributed with a mean of 7 cm and a standard deviation of 1.2 cm. He classifies the apples according to their diameters as shown in the following table.
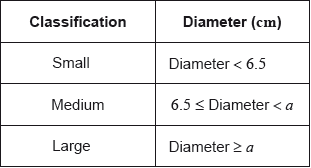
Calculate the percentage of small apples in Daniel’s harvest.[3]
Daniel assumes that the diameters of all of the apples from his harvest are normally distributed with a mean of 7 cm and a standard deviation of 1.2 cm. He classifies the apples according to their diameters as shown in the following table.

Of the apples harvested, 5% are large apples.
Find the value of \(a\).[2]
Daniel assumes that the diameters of all of the apples from his harvest are normally distributed with a mean of 7 cm and a standard deviation of 1.2 cm. He classifies the apples according to their diameters as shown in the following table.

Find the percentage of medium apples.[2]
Daniel assumes that the diameters of all of the apples from his harvest are normally distributed with a mean of 7 cm and a standard deviation of 1.2 cm. He classifies the apples according to their diameters as shown in the following table.

This year, Daniel estimates that he will grow \({\text{100}}\,{\text{000}}\) apples.
Estimate the number of large apples that Daniel will grow this year.[2]
Answer/Explanation
Markscheme
(i) \(6.76{\text{ (cm)}}\) (G2)
Notes: Award (M1) for an attempt to use the formula for the mean with a least two rows from the table.
(ii) \(1.14{\text{ (cm)}}\;\;\;\left( {1.14122 \ldots {\text{ (cm)}}} \right)\) (G1)
\({\text{P}}({\text{diameter}} < 6.5) = 0.338\;\;\;(0.338461)\) (M1)(A1)
Notes: Award (M1) for attempting to use the normal distribution to find the probability or for correct region indicated on labelled diagram. Award (A1) for correct probability.
\(33.8(\% )\) (A1)(ft)(G3)
Notes: Award (A1)(ft) for converting their probability into a percentage.
\({\text{P}}({\text{diameter}} \geqslant a) = 0.05\) (M1)
Note: Award (M1) for attempting to use the normal distribution to find the probability or for correct region indicated on labelled diagram.
\(a = 8.97{\text{ (cm)}}\;\;\;(8.97382 \ldots )\) (A1)(G2)
\(100 – (5 + 33.8461 \ldots )\) (M1)
Note: Award (M1) for subtracting “\(5+\) their part (b)” from 100 or (M1) for attempting to use the normal distribution to find the probability \({\text{P}}\left( {6.5 \leqslant {\text{diameter}} < {\text{their part (c)}}} \right)\) or for correct region indicated on labelled diagram.
\( = 61.2(\% )\;\;\;\left( {61.1538 \ldots (\% )} \right)\) (A1)(ft)(G2)
Notes: Follow through from their answer to part (b). Percentage symbol is not required. Accept \(61.1(\%)\) (\(61.1209\ldots(\%)\)) if \(8.97\) used.
\(100\,000 \times 0.05\) (M1)
Note: Award (M1) for multiplying by \(0.05\) (or \(5\%\)).
\( = 5000\) (A1)(G2)
Question
A speed camera on Peterson Road records the speed of each passing vehicle. The speeds are found to be normally distributed with a mean of \(67\,{\text{km}}\,{{\text{h}}^{ – 1}}\) and a standard deviation of \(3.4\,{\text{km}}\,{{\text{h}}^{ – 1}}\).
Sketch a diagram of this normal distribution and shade the region representing the probability that the speed of a vehicle is between \(60\) and \(70\,{\text{km}}\,{{\text{h}}^{ – 1}}\).[2]
A vehicle on Peterson Road is chosen at random.
Find the probability that the speed of this vehicle is
(i) more than \(60\,{\text{km}}\,{{\text{h}}^{ – 1}}\);
(ii) less than \(70\,{\text{km}}\,{{\text{h}}^{ – 1}}\);
(iii) between \(60\) and \(70\,{\text{km}}\,{{\text{h}}^{ – 1}}\).[3]
It is found that \(19\,\% \) of the vehicles are exceeding the speed limit of \(s\,{\text{km}}\,{{\text{h}}^{ – 1}}\).
Find the value of \(s\) , correct to the nearest integer.[2]
There is a fine of \({\text{US}}\$ 65\) for exceeding the speed limit on Peterson Road. On a particular day the total value of fines issued was \({\text{US}}\$ 14\,820\).
(i) Calculate the number of fines that were issued on this day.
(ii) Estimate the total number of vehicles that passed the speed camera on Peterson Road on this day.[4]
Answer/Explanation
Markscheme

(A1)(A1)
Note: Award (A1) for normal curve with mean of \(67\) indicated or two vertical lines drawn approximately in correct place. Award (A1) for correct shaded region (between the vertical lines.).
(i) \(0.980\,\,\,(0.980244…,\,\,98.0\,\% )\) (G1)
(ii) \(0.811\,\,\,(0.811207…,\,\,81.1\,\% )\) (G1)
(iii) \(0.791\,\,\,(0.791451…,\,\,79.1\,\% )\) (G1)
\({\text{P}}\,\left( {S > s} \right) = 19\,\% \,\,(0.19)\) OR \({\text{P}}\,\left( {S > s} \right) = 81\,\% \,\,(0.81)\) (M1)
OR

(M1)
Note: Award (M1) for the correct probability equation OR for a correct region indicated on labelled diagram.
\((s = )\,\,70.0\,\,\,(69.9848…)\) (A1)(G2)
Note: Award (M1) for any correct method.
(i) \(\frac{{14\,820}}{{65}}\) (M1)
Note: Award (M1) for dividing \(14\,820\) by \(65\).
\( = 228\) (A1)(G2)
(ii) \(\frac{{{\text{their 228}}}}{{0.19}}\) (or equivalent) (M1)
\( = 1200\) (vehicles) (A1)(ft)(G2)
Note: Award (M1) for correct method. Follow through from their part (d)(i).
