▶️ Answer/Explanation
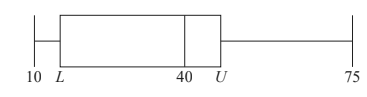
To find the minimum possible value of \( U \):
- Given the interquartile range (IQR) is 20 grams:
\[ IQR = U – L = 20 \]
- For no outliers, the maximum value must satisfy:
\[ \text{Maximum} \leq U + 1.5 \times IQR \]
- From the box plot, maximum value is 75 grams:
\[ 75 \leq U + 1.5 \times 20 \]
\[ 75 \leq U + 30 \]
\[ U \geq 45 \]
Thus, the minimum possible value of \( U \) is \( \boxed{45} \) grams.
Using the result from part (a) and the given IQR:
- From \( IQR = U – L = 20 \):
\[ L = U – 20 \]
- Using the minimum \( U = 45 \):
\[ L = 45 – 20 = 25 \]
- Verify no lower outliers:
\[ \text{Minimum} \geq L – 1.5 \times IQR \]
\[ \text{Minimum} \geq 25 – 30 = -5 \] (which is automatically satisfied as weights can’t be negative)
Thus, the minimum possible value of \( L \) is \( \boxed{25} \) grams.
▶️ Answer/Explanation
Using the confirmed values:
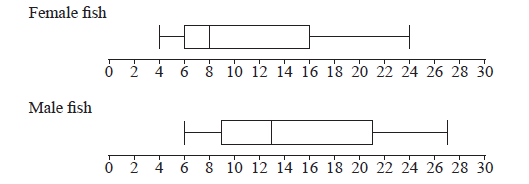
- Female fish range: 4cm to 24cm
- Male fish range: 6cm to 27cm
Range calculation:
Overall minimum = min(4cm, 6cm) = 4cm
Overall maximum = max(24cm, 27cm) = 27cm
Range = Maximum – Minimum = 27cm – 4cm = 23cm
\(\boxed{23 \text{ cm}}\)
Female fish cumulative frequency points:
| Length (cm) | Cumulative % | Description |
|---|---|---|
| 4 | 0% | Minimum |
| 6 | 25% | Q1 |
| 8 | 50% | Median |
| 16 | 75% | Q3 |
| 24 | 100% | Maximum |
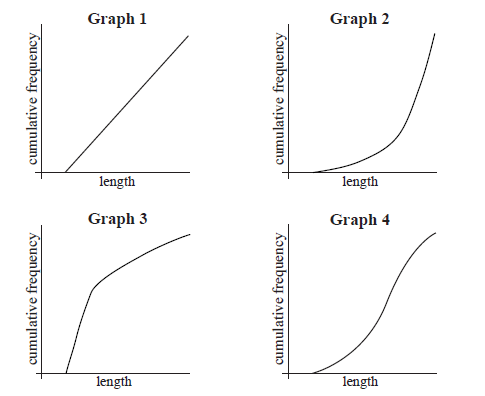
Graph Selection:
The correct graph must show:
- Begins at (4cm, 0%)
- 25% cumulative frequency at 6cm
- 50% at 8cm
- Steep increase between 8cm-16cm (50%-75%)
- Gradual approach to 100% at 24cm
This pattern matches Graph 3 in the original image, which shows:
- Initial rapid increase (0-6cm)
- Slower progression (6-8cm)
- Steep middle section (8-16cm)
- Final leveling off (16-24cm)
\(\boxed{\text{Graph 3}}\)