Tangents and Normals at a Given Point — Analytic Approach
Given a function \( y = f(x) \):
Tangent at a point: The slope of the tangent at \( x = x_0 \) is \( f'(x_0) \).
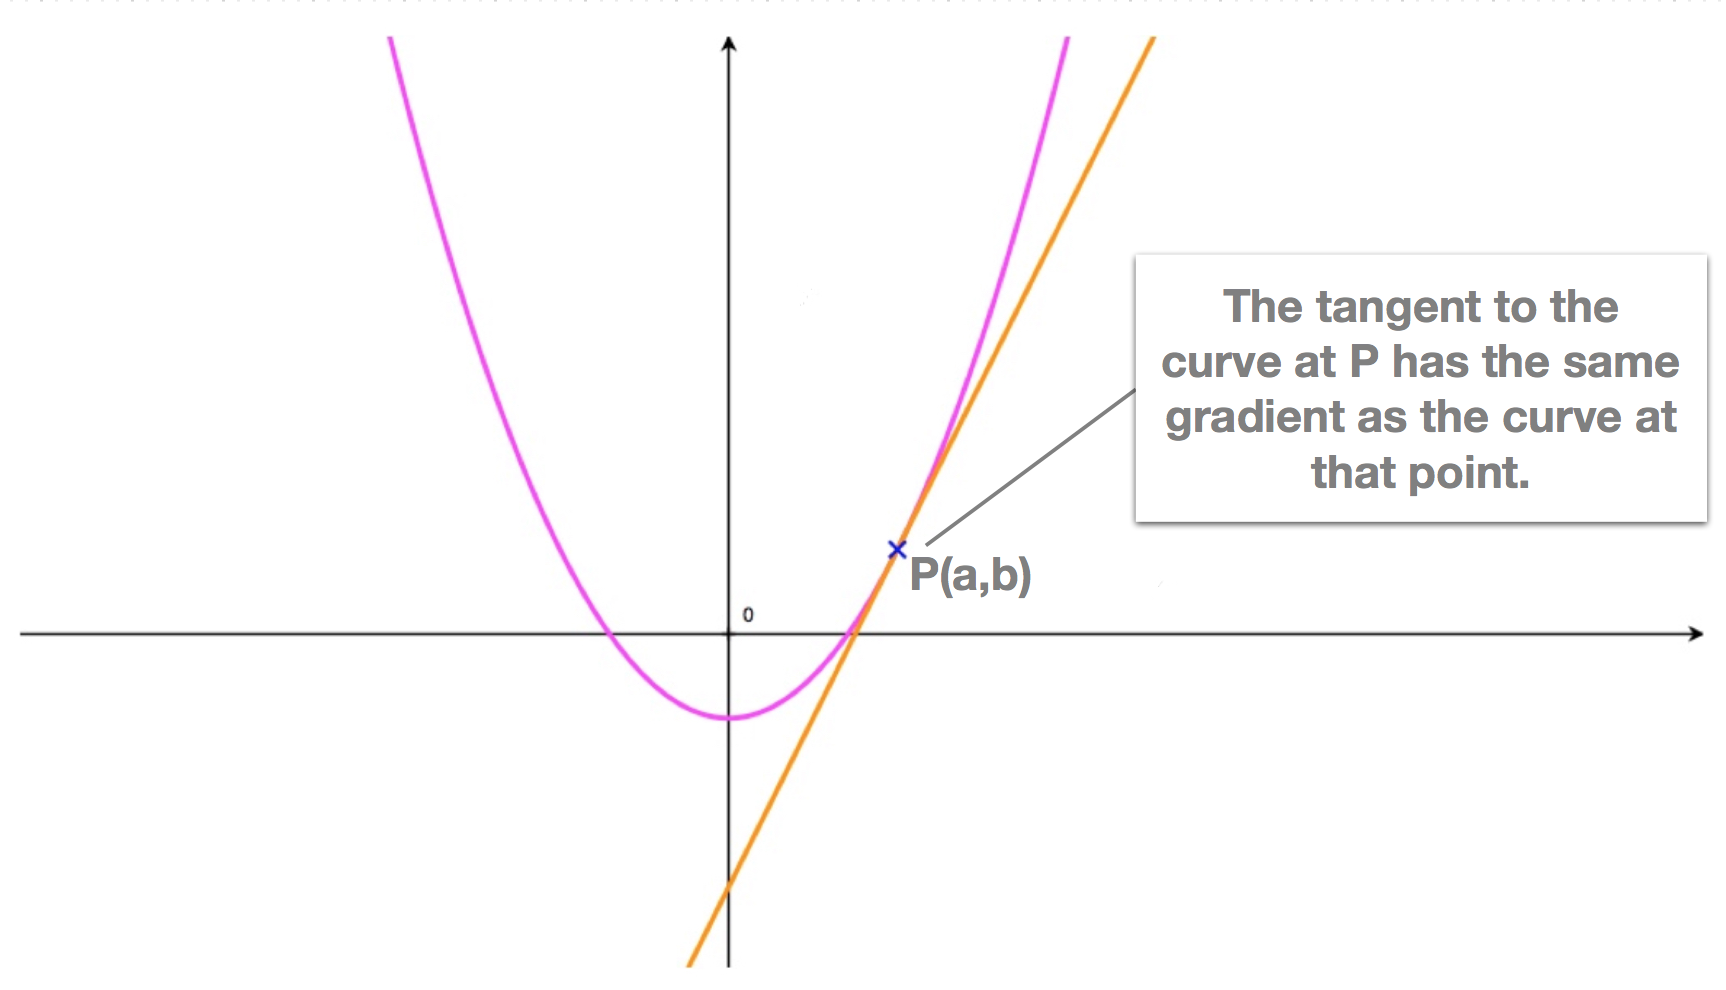
Normal at a point: The normal is perpendicular to the tangent. Its slope is \( -\frac{1}{f'(x_0)} \) (if \( f'(x_0) \neq 0 \)).

Equation of the tangent line:
\( y – y_0 = f'(x_0)(x – x_0) \) where \( y_0 = f(x_0) \)
Equation of the normal line:
\( y – y_0 = -\frac{1}{f'(x_0)}(x – x_0) \)
Example:
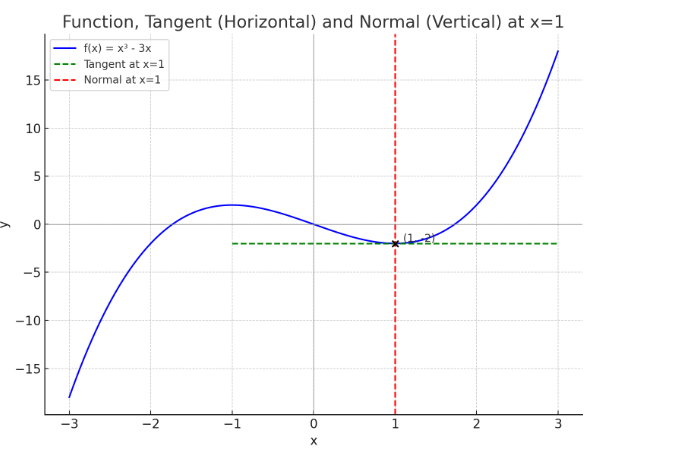
Find the equations of the tangent and normal to \( y = x^3 – 3x \) at the point where \( x = 1 \).
▶️ Answer/Explanation
\( y_0 = 1^3 – 3(1) = 1 – 3 = -2 \)
\( f'(x) = 3x^2 – 3 \)
\( f'(1) = 3(1)^2 – 3 = 3 – 3 = 0 \)
The tangent is horizontal: \( y = -2 \)
The normal is vertical (since the tangent is horizontal): \( x = 1 \)
Tangents and Normals Using Technology (GDC Steps)
You can use a graphing calculator or graphing software (e.g. TI-Nspire, Casio fx-CG50, Desmos) to find the tangent or normal at a point on a curve. Here’s how:
- Enter the function
- Input your function \( f(x) \) into the graphing calculator’s graph mode.
- Plot the graph
- Set an appropriate viewing window and display the graph of \( f(x) \).
- Select the tangent or normal tool
- On TI-Nspire: Menu → Analyze Graph → Tangent Line or Normal Line
- On Casio: Interactive → Geometry → Tangent / Normal
- On Desmos: Type derivative at point or use tools to find tangent line.
- Specify the point
- Move the cursor along the graph to the desired \( x \)-value or enter it directly (e.g., \( x = 2 \)).
- Read off the equation
- The GDC displays the equation of the tangent (or normal) line in the form: \( y = m(x – x_0) + y_0 \) or simplified to \( y = mx + c \).
 |  |  |
The technology computes \( f'(x_0) \) to find the slope of the tangent and derives the normal slope as \( -\frac{1}{f'(x_0)} \).
Example:
Use your GDC to find the tangent and normal lines to \( f(x) = x^2 + 2x \) at \( x = 1 \).
▶️ Answer/Explanation
- Enter \( f(x) = x^2 + 2x \) into the graphing calculator or Desmos.
- Plot the function on a suitable window (e.g., \( -5 \le x \le 5 \)).
- Select:
TI-Nspire → Menu → Analyze Graph → Tangent Line → click or enter \( x=1 \).
Casio → Interactive → Geometry → Tangent → click \( x=1 \). - The GDC shows the tangent line: Compute manually for confirmation: \( f'(x) = 2x + 2 \) \( f'(1) = 2(1) + 2 = 4 \) \( f(1) = 1 + 2 = 3 \) Tangent: \( y – 3 = 4(x – 1) \Rightarrow y = 4x – 1 \)
- Now find the normal line using: TI-Nspire → Menu → Analyze Graph → Normal Line → \( x=1 \) Casio → Interactive → Geometry → Normal → \( x=1 \) Normal: \( y – 3 = -\frac{1}{4}(x – 1) \Rightarrow y = -\frac{1}{4}x + \frac{13}{4} \)
