IB Mathematics AA Venn and tree diagrams, counting principles Study Notes
IB Mathematics AA Venn and tree diagrams, counting principles Notes Offer a clear explanation of Venn and tree diagrams, counting principles, including various formula, rules, exam style questions as example to explain the topics. Worked Out examples and common problem types provided here will be sufficient to cover for topic Venn and tree diagrams, counting principles.
Use of Diagrams and Tables to Calculate Probabilities
We can use different visual and tabular methods to help list outcomes, define events, and calculate probabilities. These methods include:
Venn Diagrams
Venn diagrams are used to represent sets of outcomes and their relationships visually.
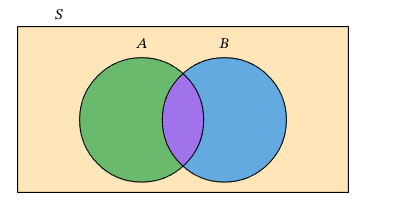
In the diagram above, we have two events $A$ and $B$ within the sample space (or universal set) $S$. Sometimes, the sample space is denoted by $\sigma$ or $\xi$ instead of $S$. Colored regions in this Venn diagram represent the following events:
- Green and purple regions : $A$,
- Blue and purple regions : $B$,
- Purple region : $A \cap B$,
- Green, purple, and blue regions : $A \cup B$,
- Yellow region : $\overline{A \cup B}$, alternatively, $(A \cup B)’$.
Tree Diagrams
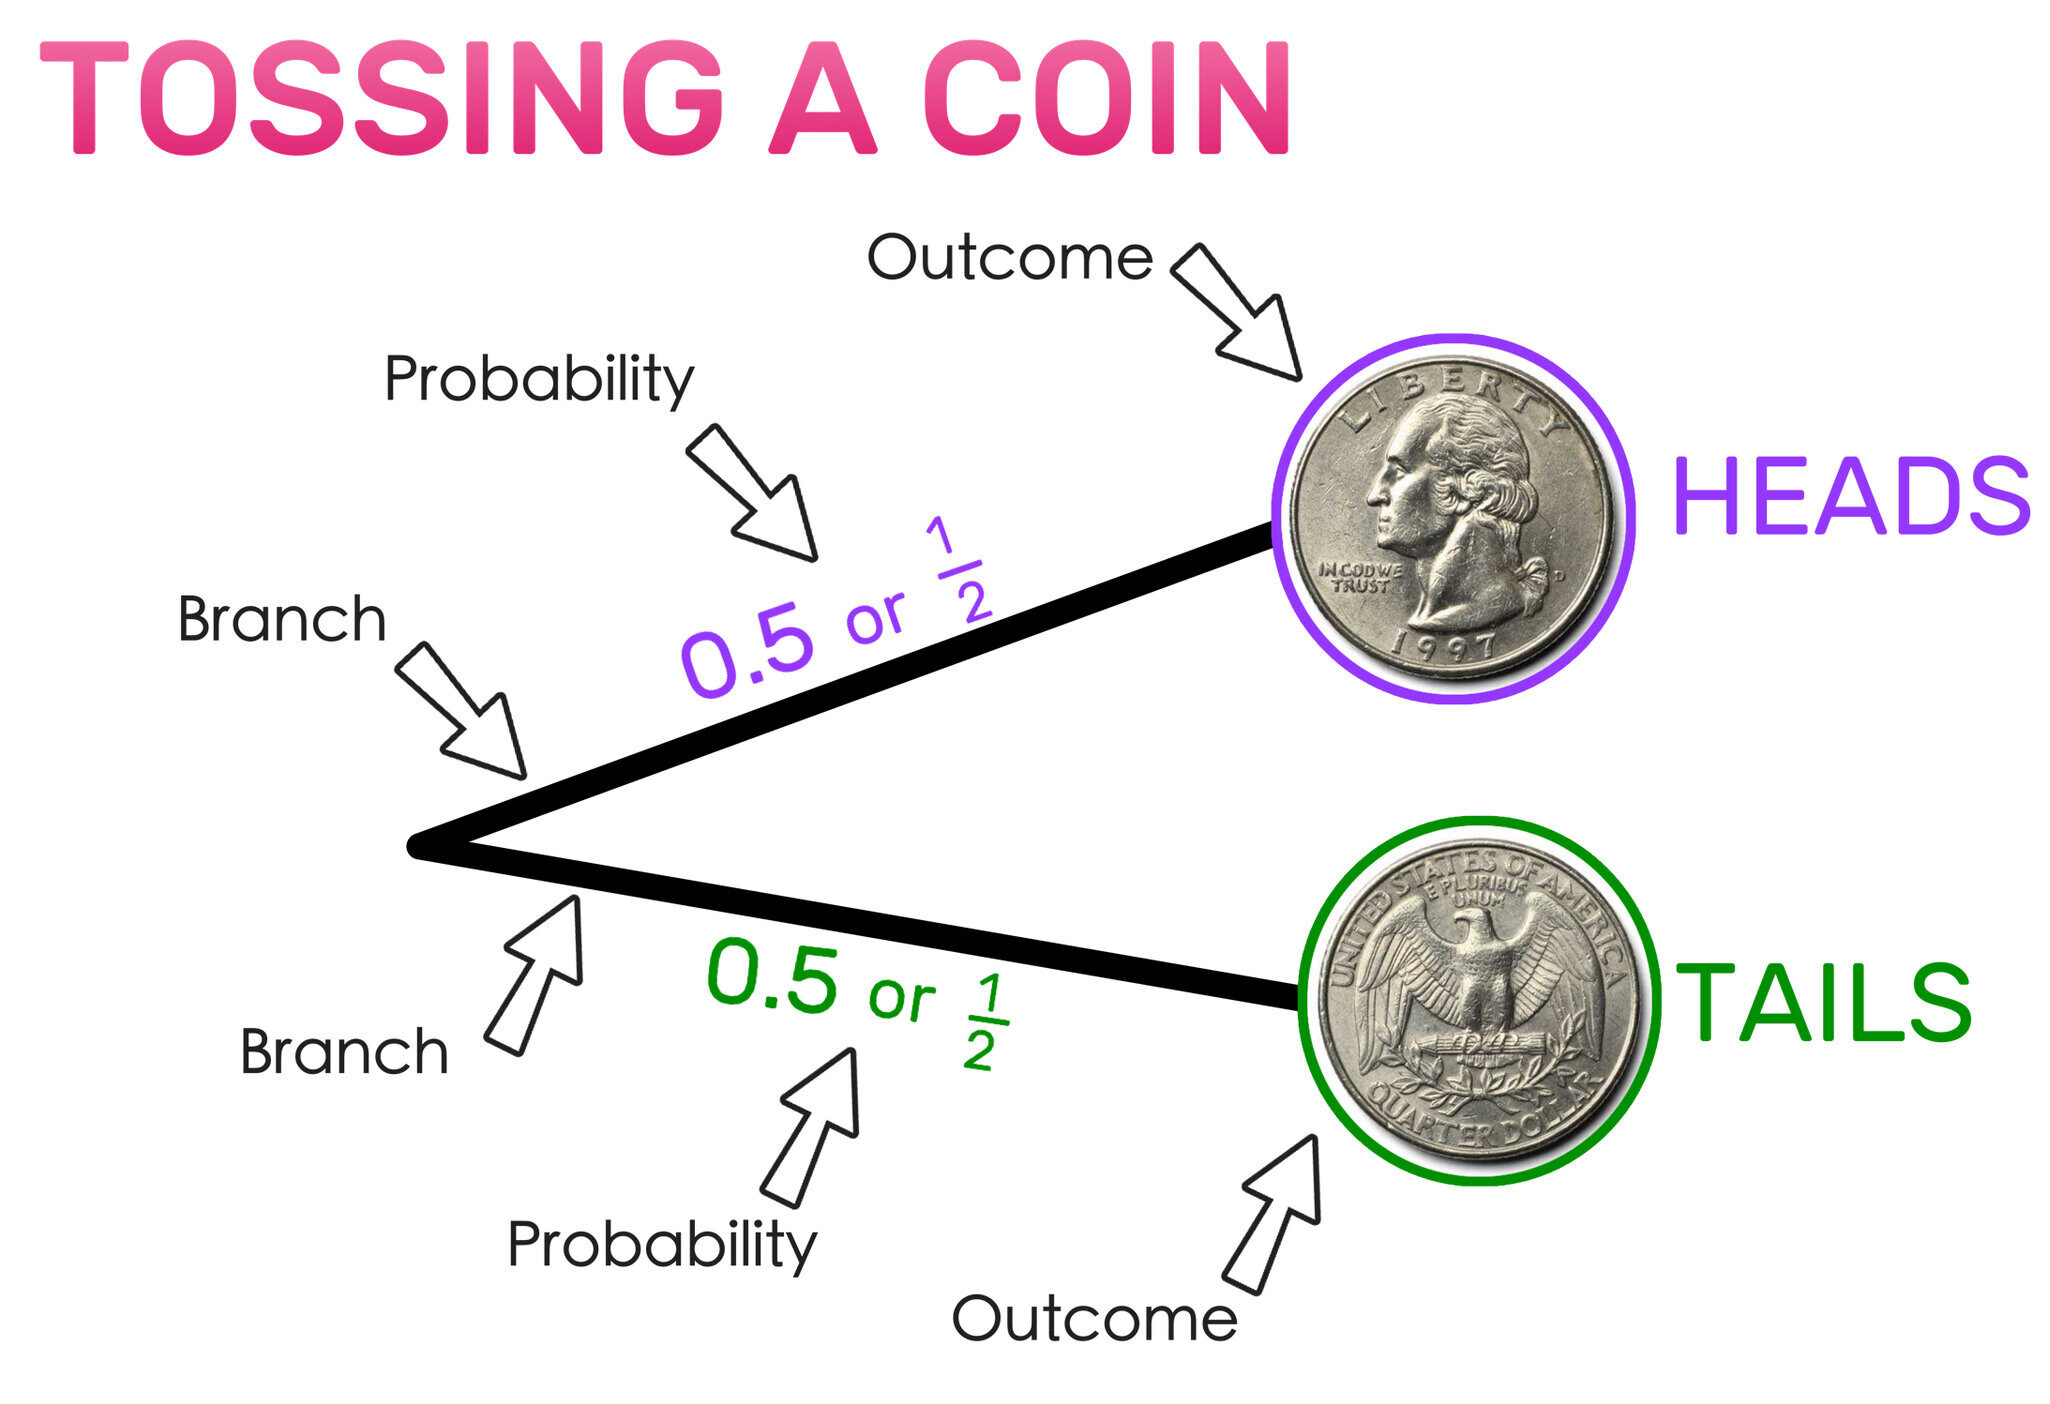
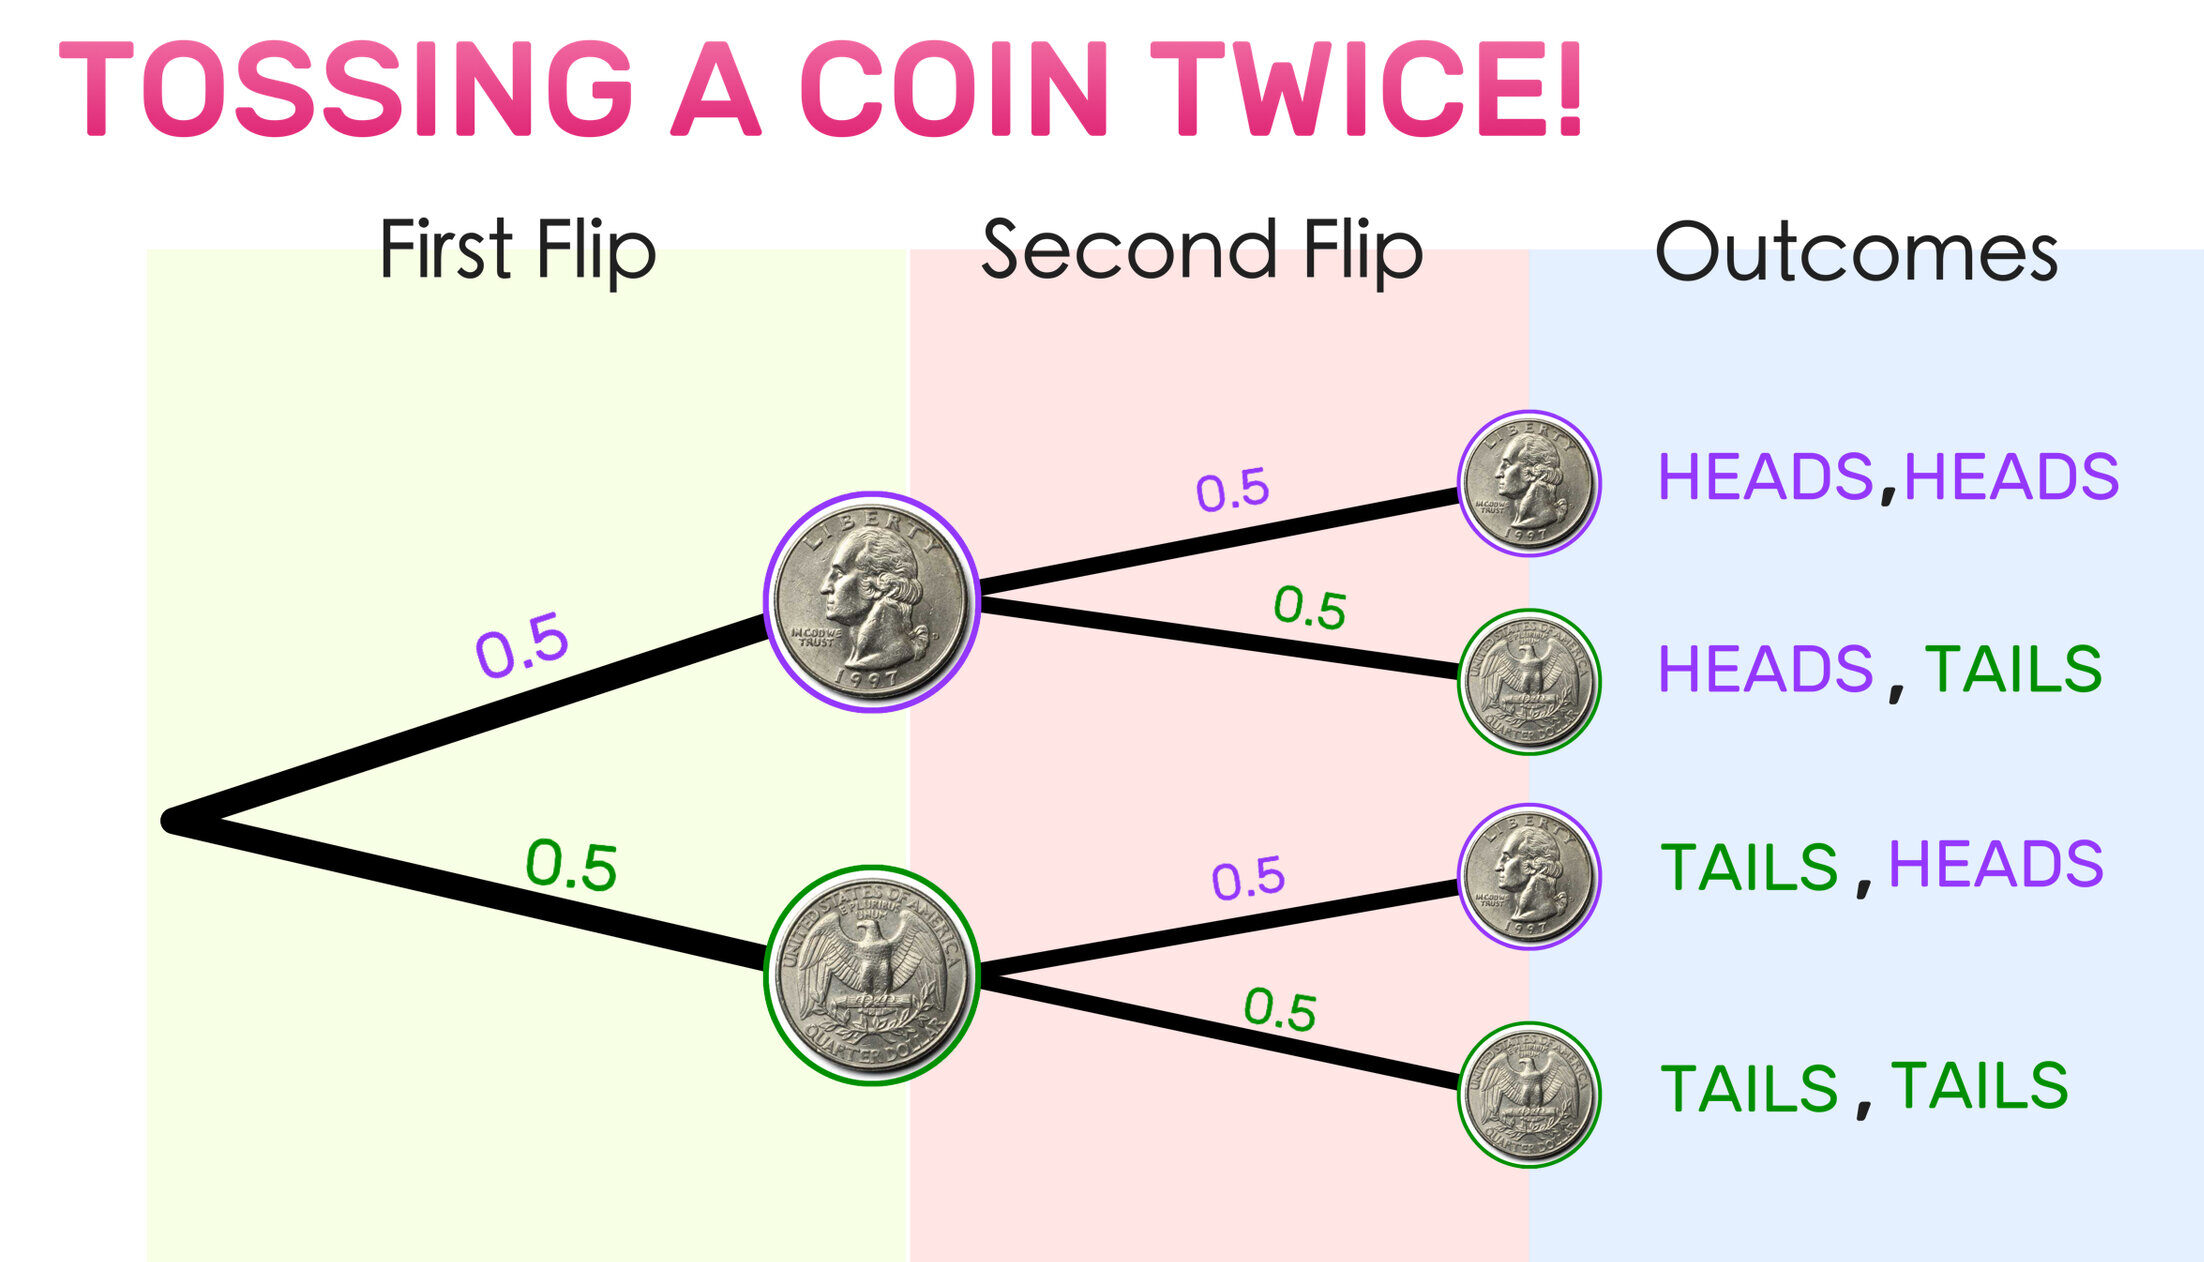
Tree diagrams show all possible outcomes of multi-stage events in a branching structure.
- Each branch represents an outcome at a stage.
- Probabilities are written on branches.
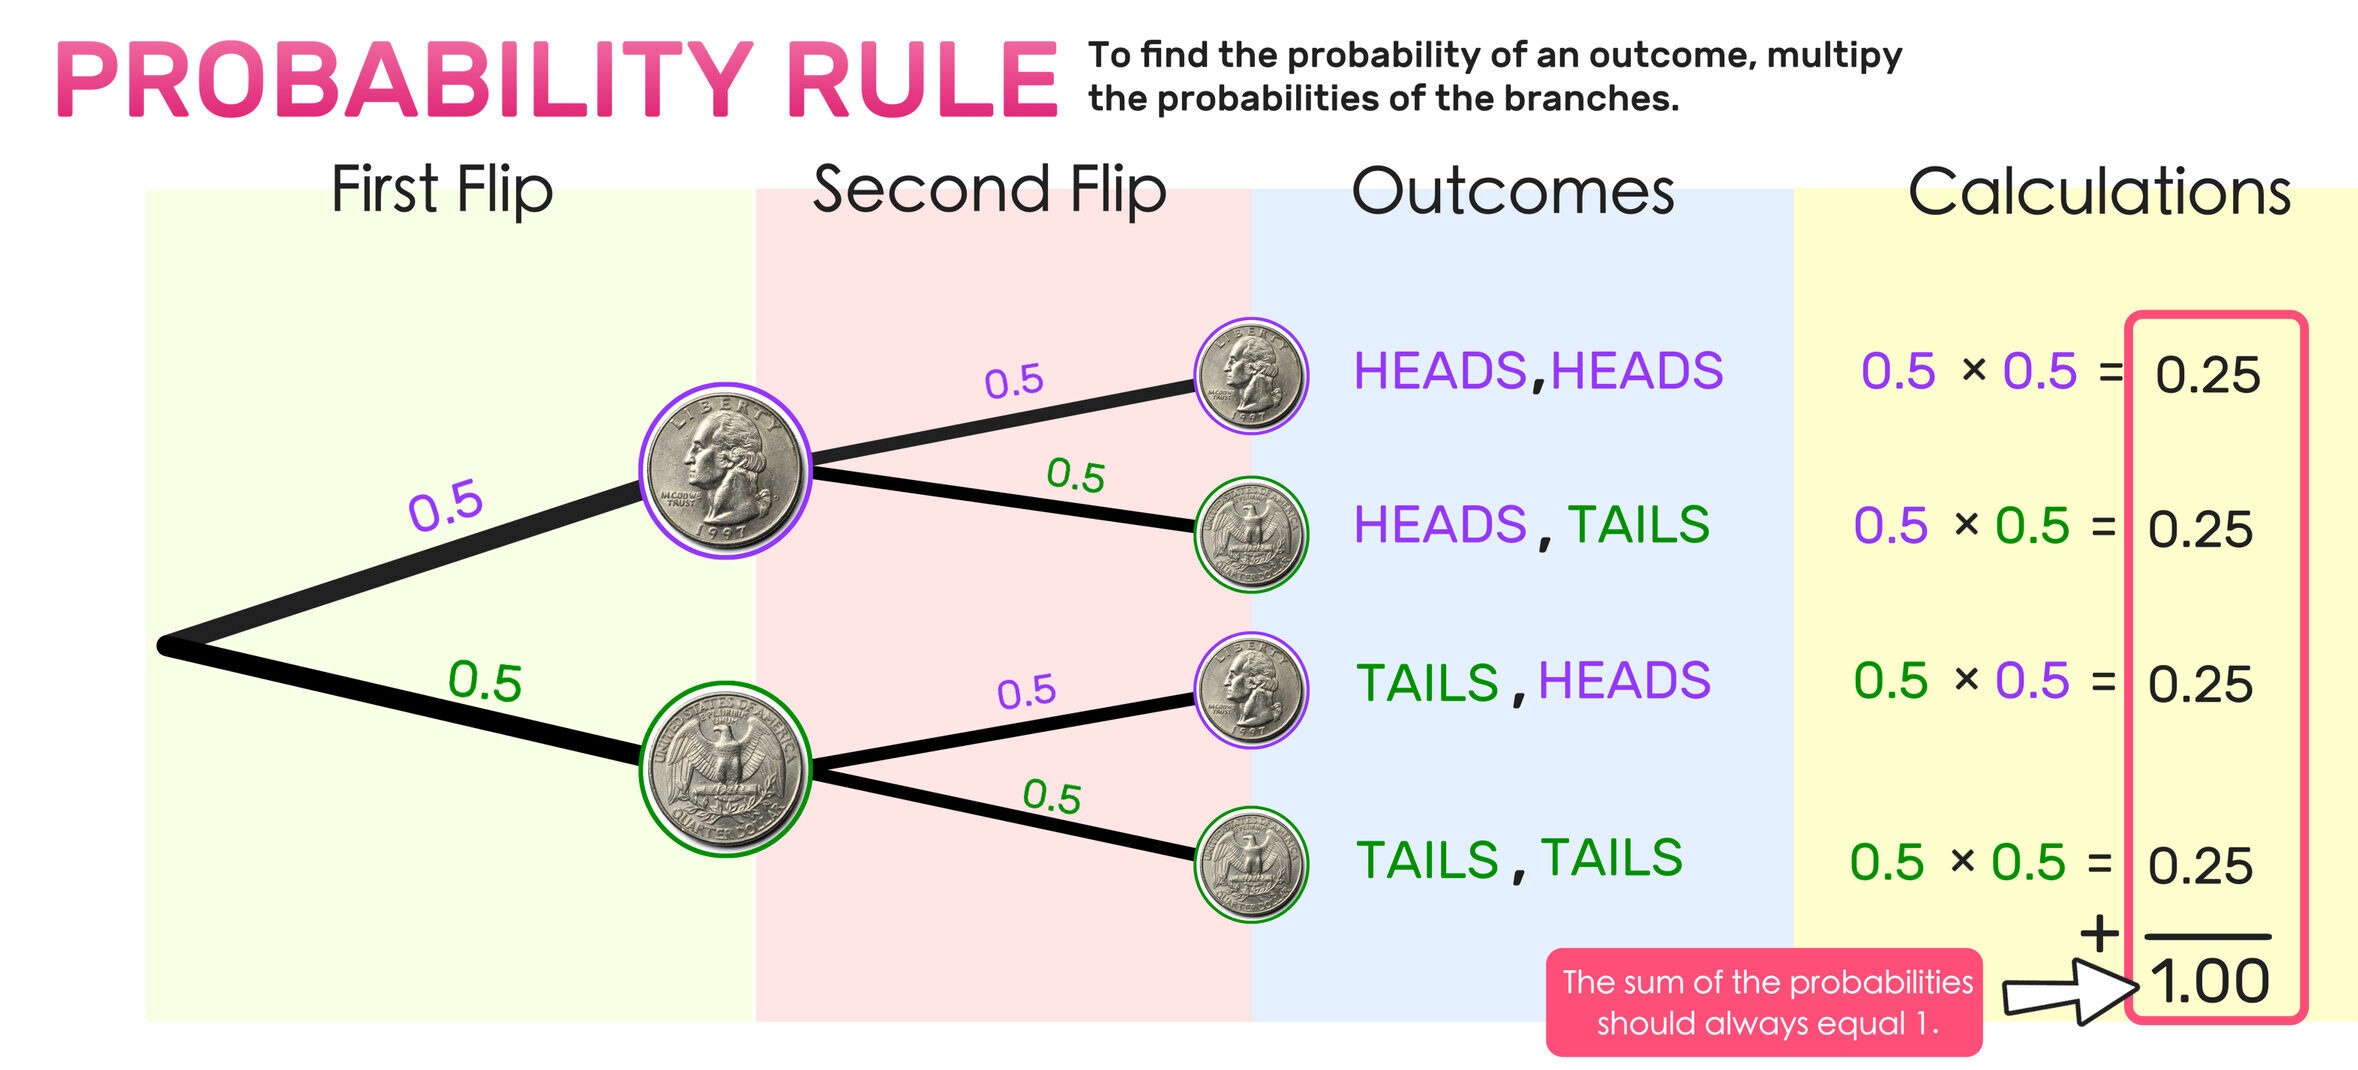
- To find the probability of a complete path (outcome sequence), multiply along the branches.
- To find the probability of an event, add up probabilities of relevant paths.
- \(\text{Path probability} = \text{product of branch probabilities}\)
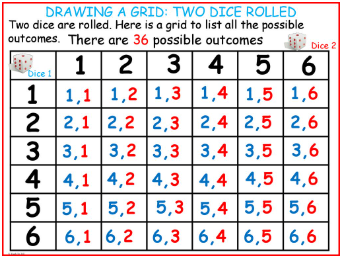
Sample Space Diagrams
A sample space diagram lists all possible outcomes in an organized way. It is especially useful for:
- Rolling two dice (as a grid)
- Tossing multiple coins
It helps identify outcomes satisfying certain conditions and makes counting outcomes easier.
Example grid for two dice:
Tables of Outcomes
Tables can be used to display all combinations of outcomes, especially for numerical results (e.g. sum of dice).
- Rows and columns represent possible values of different variables.
- Each cell shows an outcome or result (e.g. sum of two dice).
You can use the table to:
- Count favourable outcomes
- Calculate probabilities: \( P(A) = \frac{\text{number of favourable outcomes}}{\text{total outcomes}} \)
Example:
A bag contains 3 red balls and 2 blue balls. Two balls are drawn one after the other without replacement. Find:
- The probability that both balls are red (use tree diagram idea)
- The probability that at least one ball is red (use complement and Venn diagram idea)
▶️ Answer/Explanation
Represent with a tree diagram
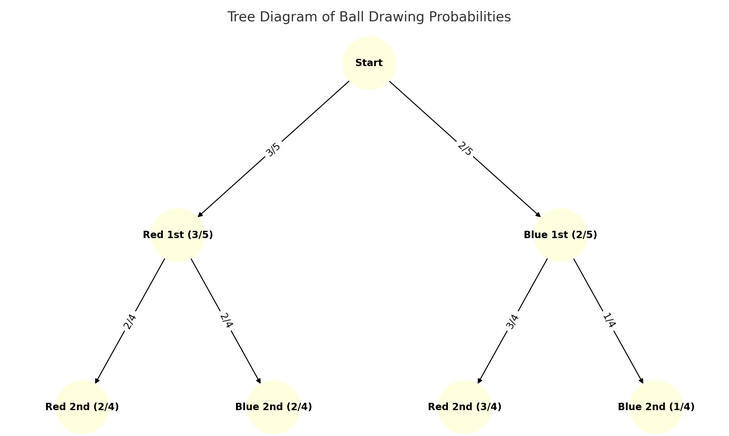
First ball: \( P(\text{Red}) = \frac{3}{5}, P(\text{Blue}) = \frac{2}{5} \)
Second ball if first was red: \( P(\text{Red}) = \frac{2}{4}, P(\text{Blue}) = \frac{2}{4} \)
Second ball if first was blue: \( P(\text{Red}) = \frac{3}{4}, P(\text{Blue}) = \frac{1}{4} \)
Probability both are red
\( P(\text{Red, Red}) = P(\text{Red first}) \times P(\text{Red second}) \)
\( = \frac{3}{5} \times \frac{2}{4} \)
\( = \frac{3}{5} \times \frac{1}{2} = \frac{3}{10} \)
Represent with a Venn diagram
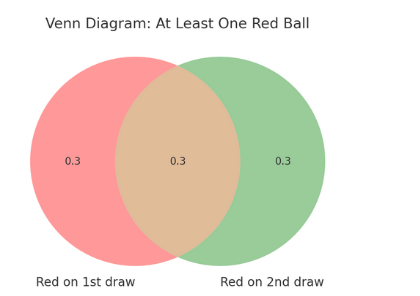
Probability at least one red
Let A = at least one red. Then A’ = no red = both blue.
\( P(\text{Blue, Blue}) = \frac{2}{5} \times \frac{1}{4} = \frac{2}{20} = \frac{1}{10} \)
\( P(\text{At least one red}) = 1 – P(\text{both blue}) = 1 – \frac{1}{10} = \frac{9}{10} \)
Conclusion:
- The probability that both balls are red is \( \frac{3}{10} \).
- The probability of at least one red ball is \( \frac{9}{10} \).
Combined Events & Mutually Exclusive Events
Combined Events: The Non-Exclusivity of “or”
When we calculate the probability of event A or event B (written as \( A \cup B \)), we must account for whether A and B can happen together or not.
If A and B are not mutually exclusive (they can occur together):
\( P(A \cup B) = P(A) + P(B) – P(A \cap B) \)
We subtract \( P(A \cap B) \) because outcomes where both A and B occur would otherwise be counted twice.
Mutually Exclusive Events
Events A and B are mutually exclusive if they cannot occur at the same time. That is:
\( P(A \cap B) = 0 \)
For mutually exclusive events, the probability of A or B simplifies to:
\( P(A \cup B) = P(A) + P(B) \)
Example:
A single card is drawn from a standard pack of 52 playing cards.
Let:
- A = event that the card is a heart
- B = event that the card is a king
Find the probability of \( A \cup B \):
- When A and B are not mutually exclusive
- When A and B are mutually exclusive (suppose A = heart, B = club)
▶️ Answer/Explanation
A and B are not mutually exclusive
There are 13 hearts, so \( P(A) = \frac{13}{52} \).
There are 4 kings, so \( P(B) = \frac{4}{52} \).
One card is both a heart and a king (king of hearts), so \( P(A \cap B) = \frac{1}{52} \).
Using the formula for combined probability of non-exclusive events:
\( P(A \cup B) = P(A) + P(B) – P(A \cap B) \)
\( = \frac{13}{52} + \frac{4}{52} – \frac{1}{52} \)
\( = \frac{16}{52} = \frac{4}{13} \)
A and B are mutually exclusive
Let B = event that the card is a club.
There are 13 clubs, so \( P(B) = \frac{13}{52} \).
Since no card can be both a heart and a club: \( P(A \cap B) = 0 \).
Then:
\( P(A \cup B) = P(A) + P(B) \)
\( = \frac{13}{52} + \frac{13}{52} \)
\( = \frac{26}{52} = \frac{1}{2} \)
Conclusion:
- When A and B overlap: \( P(A \cup B) = \frac{4}{13} \)
- When A and B are exclusive: \( P(A \cup B) = \frac{1}{2} \)
Conditional Probability
The probability of event A occurring given that event B has already occurred is called the conditional probability of A given B.
\( P(A|B) = \frac{P(A \cap B)}{P(B)} \quad \text{(provided } P(B) \neq 0 \text{)} \)
This tells us how likely A is when we know B has happened.
Probabilities With and Without Replacement
- With replacement: After each selection, the item is put back. Probabilities stay the same for each draw because the total number of items doesn’t change.
- Without replacement: Items are not put back. Probabilities change after each selection because the total number of items decreases.
Conditional probability is important for calculating probabilities in cases without replacement.
Example:
A bag contains 3 red and 2 blue balls. Two balls are drawn one after the other without replacement. Find the probability that the second ball is blue given that the first ball was red.
▶️ Answer/Explanation
\( P(\text{first red}) = \frac{3}{5} \)
After 1 red is removed, \( P(\text{second blue | first red}) = \frac{2}{4} = \frac{1}{2} \)
So, \( P(\text{first red and second blue}) = \frac{3}{5} \times \frac{1}{2} = \frac{3}{10} \)
\( P(\text{first red}) = \frac{3}{5} \)
conditional probability
\( P(\text{second blue | first red}) = \frac{P(\text{first red and second blue})}{P(\text{first red})} \)
\( = \frac{\frac{3}{10}}{\frac{3}{5}} \)
\( = \frac{3}{10} \times \frac{5}{3} = \frac{1}{2} \)
Conclusion: The probability that the second ball is blue given that the first was red is \( \frac{1}{2} \).
Independent events: P(A ∩ B) = P(A)P(B)
Independent Events
Two events A and B are said to be independent if the occurrence of one does not affect the probability of the other occurring.
For independent events:
\( P(A \cap B) = P(A) \times P(B) \)
This means:
- The probability of both events happening equals the product of their individual probabilities.
- Knowing that one event occurred gives no information about the other.
Example:
A fair coin is tossed and a fair die is rolled. Find the probability of getting a head on the coin and a 4 on the die.
▶️ Answer/Explanation
\( P(\text{head}) = \frac{1}{2} \)
\( P(\text{4 on die}) = \frac{1}{6} \)
Apply independence rule
Since the toss and roll are independent:
\( P(\text{head and 4}) = P(\text{head}) \times P(\text{4}) \)
\( = \frac{1}{2} \times \frac{1}{6} = \frac{1}{12} \)
Conclusion: The probability of getting a head and a 4 is \( \frac{1}{12} \).