Determining Key Features of Graphs
Graphing technology helps identify the following features of a function’s graph:
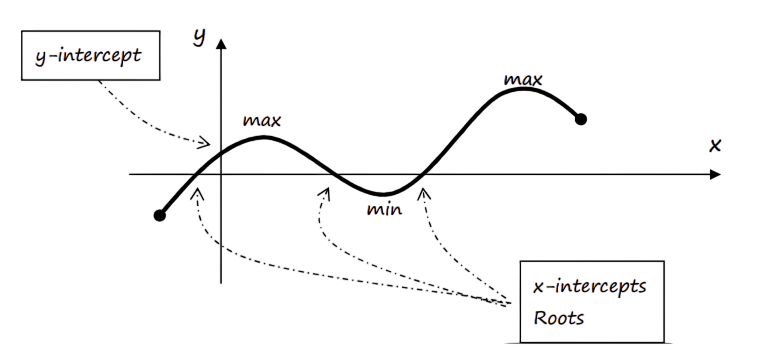
- Intercepts:
- x-intercepts (zeros/roots): where the graph crosses the x-axis (\( f(x) = 0 \)).
- y-intercept: where the graph crosses the y-axis (\( x = 0 \)).
- Maximum and Minimum Values:
- Local maxima/minima: Turning points found using “Maximum” or “Minimum” tools on your GDC.
- Absolute extrema: Highest or lowest points in a domain.
- Vertex:
- The turning point of a parabola (quadratic function), found at \( x = -\frac{b}{2a} \).
- Symmetry:
- Determine if the graph is symmetric about the y-axis, x-axis, or origin (e.g., even or odd functions).
- Asymptotes:
- Vertical asymptotes: where the function grows without bound as it approaches a certain x-value (division by zero).
- Horizontal asymptotes: the end behavior of rational/exponential functions.
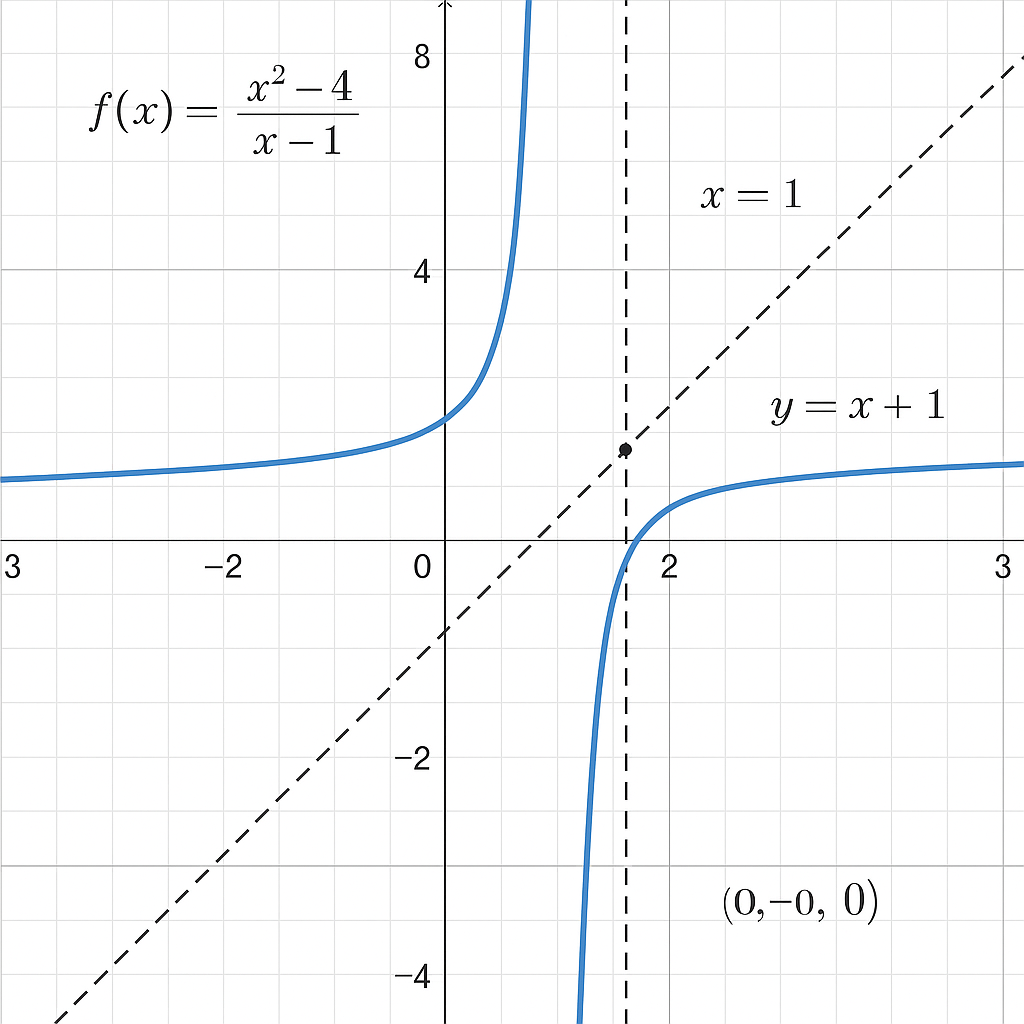
Example: Use a graphing calculator to analyze \( f(x) = \frac{x^2 – 4}{x – 1} \)
▶️Answer/Explanation
- x-intercepts: Set numerator = 0 \( x = -2, x = 2 \)
- y-intercept: \( f(0) = \frac{-4}{-1} = 4 \)
- Vertical asymptote: \( x = 1 \) (division by zero)
- Horizontal asymptote: As \( x \to \infty \), \( f(x) \to x \) → no horizontal asymptote (degree of numerator > denominator)
- Hole: None, as numerator and denominator don’t share a common factor at \( x = 1 \)
- Behavior: Use graph trace to observe the curve approaching the asymptote and turning points.
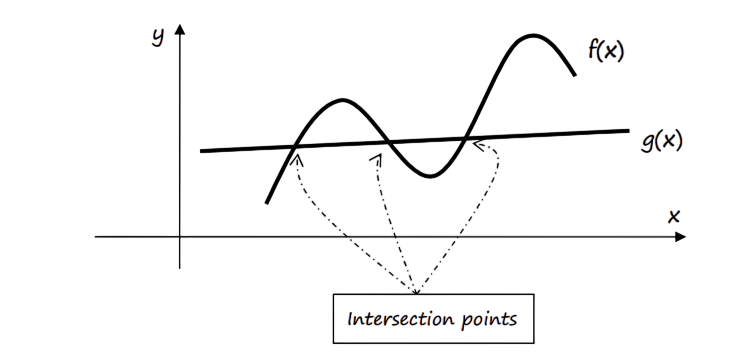
Finding the Point of Intersection of Two Curves or Lines
To find the intersection of two functions (curves or lines),we are solving the equation:
\( f(x) = g(x) \)
This represents the x-values at which the two graphs meet, and solving it gives the coordinates of their point(s) of intersection.
Steps Using a Graphing Calculator (e.g., TI-84 or software like Desmos):
- Enter both functions into the graphing calculator or software.
- Use the “Intersect” or “Find Intersection” tool from the calculate menu.
- Trace the graphs and select the region of intersection if prompted.
- The x and y coordinates of the point of intersection will be displayed.
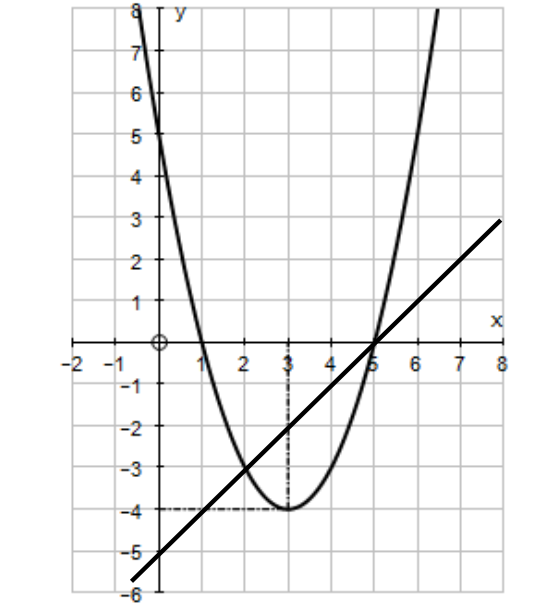
Example: Find the intersection of the functions
- \( f(x) = (x-3)^2-4 \)
- \( g(x) = x – 5 \)
▶️Answer/Explanation
- Graph both equations on your calculator or software.
- Use the “Intersect” feature (on TI-84: 2nd → Trace → Intersect).
- Select the first curve, then the second, and press ENTER.
- Calculator shows the point(s) of intersection:
- First point: \( 2,-3\)
- Second point: \(5,0\)