The Equation \( y = f(x) \)
A function is a rule that assigns to each input \( x \) exactly one output \( y \). This relationship is often written as: \( y = f(x) \), where:
- \( x \) is the input or independent variable (usually on the horizontal axis).
- \( y \) is the output or dependent variable (plotted on the vertical axis).
- \( f \) is the name of the function or rule applied to \( x \).
For example, if \( f(x) = x^2 \), then the graph of \( y = f(x) = x^2 \) is a parabola.
Graph of a Function
The graph of a function is a visual representation of all points \( (x, f(x)) \). It helps us:
- See how the output changes as the input varies
- Identify key features: intercepts, turning points, symmetry, etc.
- Understand behavior like increasing, decreasing, and discontinuities
Difference Between “Draw” and “Sketch”
| Term | Meaning | What to Include |
|---|---|---|
| Draw | Accurate diagram to scale using tools or technology | Correct scale, axis labels, points plotted precisely, often requires ruler or graphing software. |
| Sketch | Freehand graph that captures the essential shape or behavior | Key features (intercepts, turning points, asymptotes, etc.), but no need for perfect scale or precision. |
Note: When asked to “draw,” use a ruler or calculator. When asked to “sketch,” focus on the general behavior of the function.
Example :
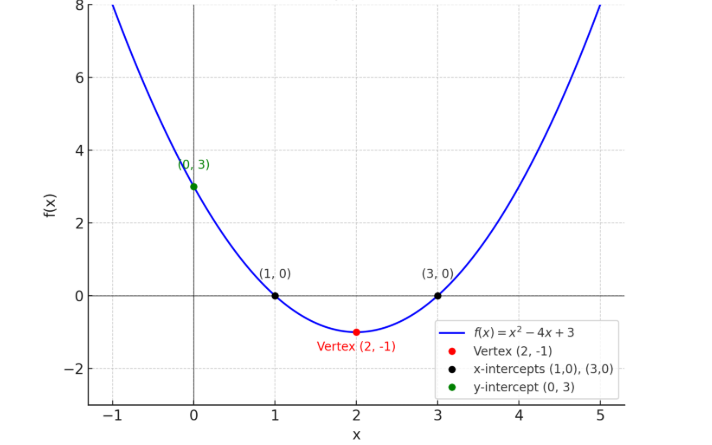
Draw the graph of the function \( f(x) = x^2 – 4x + 3 \)
▶️ Answer/Explanation
- Plot at least 5 points using a table of values.
- Find the vertex by completing the square or using \( x = \frac{-b}{2a} \).
- Mark the x-intercepts: \( x = 1 \) and \( x = 3 \).
- Mark the y-intercept: \( f(0) = 3 \).
- Draw on a clearly labeled Cartesian grid with appropriate scale.
Example :
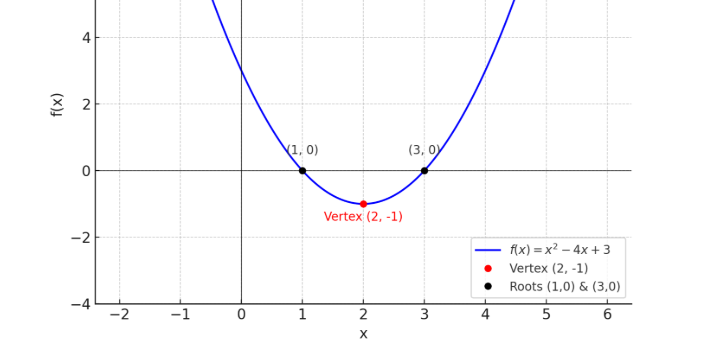
Sketch the graph of the function \( f(x) = x^2 – 4x + 3 \)
▶️ Answer/Explanation
- Indicate the general U-shape of the parabola.
- Label the vertex roughly at \( x = 2 \), \( y = -1 \).
- Mark approximate intercepts on x-axis and y-axis.
- Clearly label the axes but exact scale is not necessary.
- No need to calculate precise values.
Creating a Sketch from Information or Context
A sketch is a freehand drawing of a graph that illustrates the key features and general shape of a function. You may be asked to sketch a graph based on algebraic information, a word problem, or from a graph displayed on a screen (e.g., calculator or software).
Purpose of a Sketch
A sketch helps to visualize:
- The shape and key characteristics of a function
- The behavior of the function at certain points
- The general trend without requiring perfect scale or plotting
Key Features to Include in a Sketch
Even though a sketch is not drawn to scale, it should include:
- Axes: Clearly label x-axis and y-axis with appropriate scale/units if needed
- Intercepts: Points where the graph crosses the x-axis and y-axis
- Turning Points / Maxima / Minima: Indicate any known stationary points
- Asymptotes: Vertical, horizontal, or oblique asymptotes where applicable
- End Behavior: Indicate how the graph behaves as \( x \to \infty \) or \( x \to -\infty \)
- Domain and Range: If restricted, reflect in the sketch (e.g., open/closed circles)
Transferring a Graph from a Screen (e.g., GDC or Software)
When copying a graph from a Graphing Display Calculator (GDC) or software like Desmos or GeoGebra to paper:
- Note down the x- and y-intercepts
- Identify turning points (use the GDC “maximum” or “minimum” tools)
- Identify asymptotes (using trace or table function)
- Observe how the graph behaves as \( x \to \infty \) and \( x \to -\infty \)
- Draw the axes and plot the intercepts and key points
- Sketch a smooth curve connecting the points in the correct shape
Example :
Sketch the graph of \( f(x) = x^2 – 4x + 3 \).
▶️ Answer/Explanation
- Intercepts: Factor to get \( (x-1)(x-3) \). x-intercepts at \( x = 1 \), \( x = 3 \). y-intercept: \( f(0) = 3 \).
- Vertex: \( x = \frac{1+3}{2} = 2 \), \( f(2) = -1 \). Vertex at (2, -1).
- Sketch shape: Parabola opening upward with axis of symmetry \( x = 2 \).

Example :
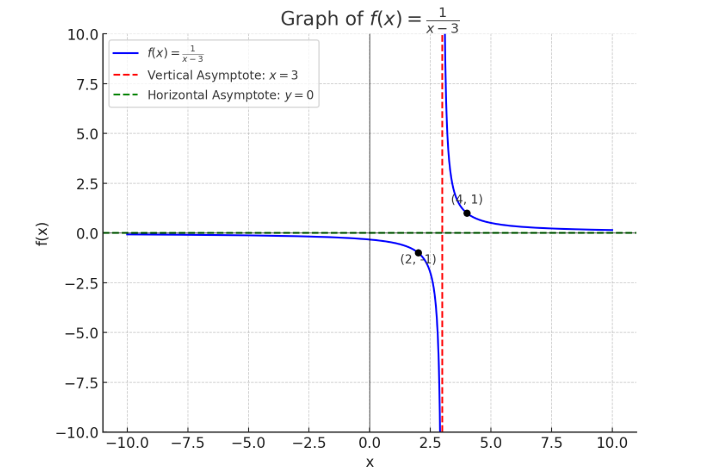
Sketch the graph of \( f(x) = \frac{1}{x-3} \).
▶️ Answer/Explanation
- Vertical Asymptote: \( x = 3 \)
- Horizontal Asymptote: \( y = 0 \)
- Key point: \( f(2) = -1 \), \( f(4) = 1 \)
- End behavior: Approaches 0 as \( x \to \pm \infty \)
Example :
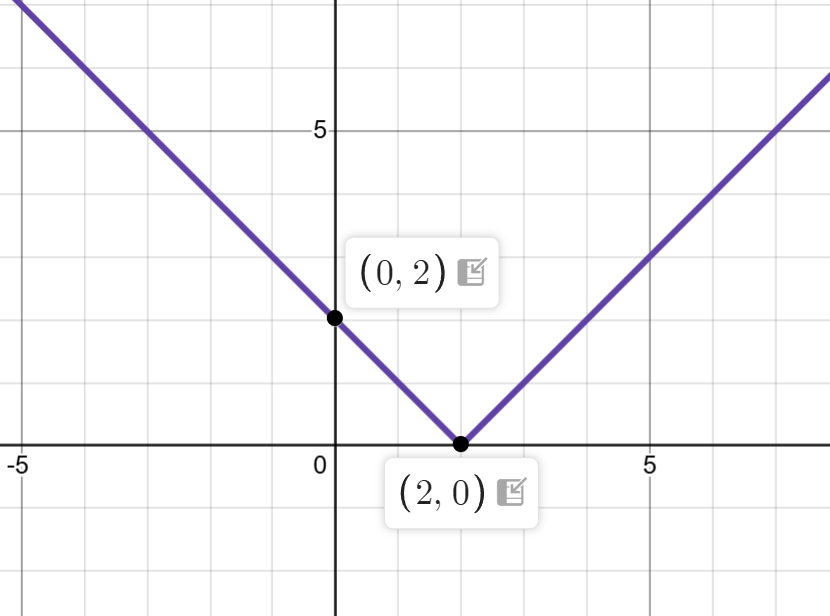
Sketch the graph of \( f(x) = |x – 2| \).
▶️ Answer/Explanation
- Vertex: At \( x = 2 \), \( f(2) = 0 \)
- Shape: V-shape opening upward
- Additional points: \( f(1) = 1 \), \( f(3) = 1 \)
Using Technology to Graph Functions, Sums, and Differences
Graphing technology such as a GDC (Graphical Display Calculator), Desmos, or GeoGebra can be used to visualize functions and their combinations.
Common Tasks with Technology:
- Plot individual functions like \( f(x) = x^2 \), \( g(x) = 2x \)
- Graph sums: \( f(x) + g(x) \)
- Graph differences: \( f(x) – g(x) \)
- Compare how each function behaves and how they combine.
Steps Using Desmos (or GDC):
- Open Desmos (or your GDC graph function screen)
- Enter the functions one by one:
f(x) = x^2g(x) = 2xf(x) + g(x)→ Desmos automatically shows the resultf(x) - g(x)
- Observe how the graphs of \( f(x) + g(x) \) and \( f(x) – g(x) \) relate to \( f(x) \) and \( g(x) \)
- You can also compare using different color graphs
Interpretation:
- The graph of \( f(x) + g(x) \) represents the pointwise sum of the y-values of \( f(x) \) and \( g(x) \) at each x. Similarly, \( f(x) – g(x) \) subtracts the y-values of \( g(x) \) from \( f(x) \) at each x.
- If \( f(x) \) and \( g(x) \) are increasing, then \( f(x) + g(x) \) typically increases faster.
- If \( f(x) = g(x) \), then \( f(x) – g(x) = 0 \) for all x.
- The shape of the resulting graph is influenced by the dominant function.
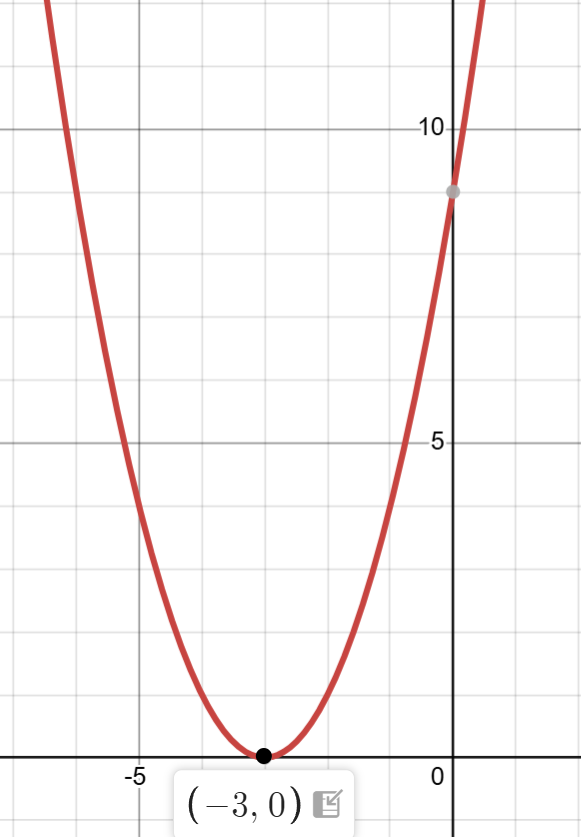
Example : Graph the sum of the functions from
- f(x) = x²
- g(x) = 6x + 9
Function: h(x) = f(x) + g(x)
▶️ Answer/Explanation
h(x) = f(x) + g(x) = x² + 6x + 9
Use your GDC to enter:
- $Y = x^2 + 6x + 9$
This is a new parabola (perfect square trinomial):
Vertex: (-3, 0) Opens: Upward
Example : Graph the difference of the functions from
- f(x) = $x^2$
- g(x) = $2x + 1$
Function: k(x) = f(x) – g(x)
▶️ Answer/Explanation
k(x) = f(x) – g(x) = $x^2- 2x – 1$
Use your GDC to enter:
- $Y = x^2- 2x – 1$
This is a parabola:
Vertex: (1, -2) Opens: Upward
