IB Mathematics AI AHL Non-linear regression MAI Study Notes- New Syllabus
IB Mathematics AI AHL Non-linear regression MAI Study Notes
LEARNING OBJECTIVE
- Non-linear regression.
Key Concepts:
- Evaluation of least squares regression curves
- Sum of square residuals
- The coefficient of determination
- IBDP Maths AI SL- IB Style Practice Questions with Answer-Topic Wise-Paper 1
- IBDP Maths AI SL- IB Style Practice Questions with Answer-Topic Wise-Paper 2
- IB DP Maths AI HL- IB Style Practice Questions with Answer-Topic Wise-Paper 1
- IB DP Maths AI HL- IB Style Practice Questions with Answer-Topic Wise-Paper 2
- IB DP Maths AI HL- IB Style Practice Questions with Answer-Topic Wise-Paper 3
NON-LINEAR REGRESSION
Non-linear regression models describe relationships between variables that cannot be captured with a straight line. These models are especially useful in AI and data science where real-world data often exhibits non-linear behavior.
Types of Non-Linear Regression Models
Quadratic Regression
Formula: $y = ax^2 + bx + c$
Used when data forms a parabolic curve, such as in projectile motion.
Cubic Regression
Formula: $y = ax^3 + bx^2 + cx + d$
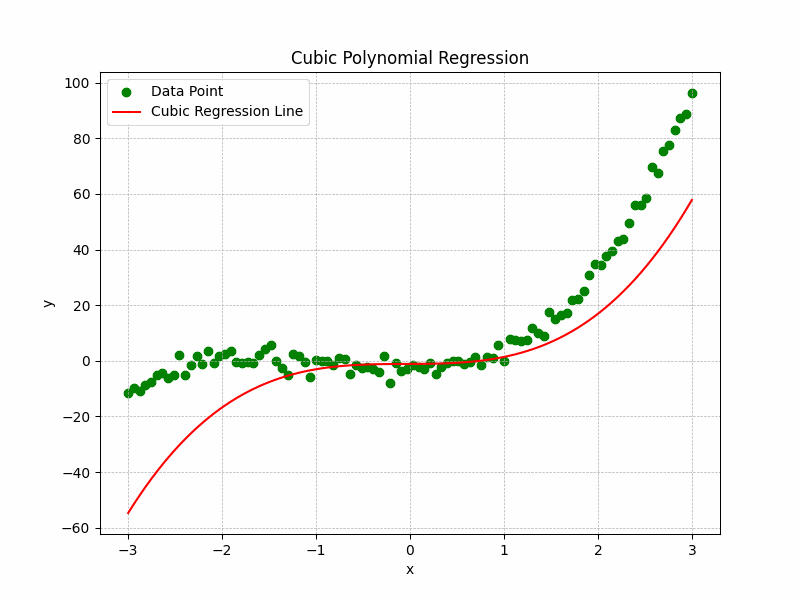
Useful when data has more than one curve or inflection point.
Exponential Regression
Formula: $y = ab^x$ or $y = ae^{bx}$
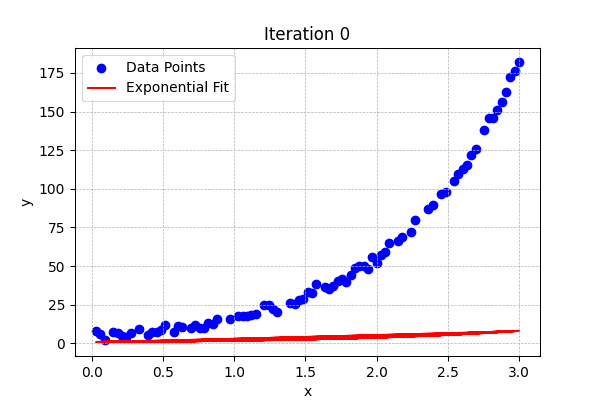
Appropriate for growth or decay processes, such as population growth or bacterial growth.
Power Regression
Formula: $y = ax^b$
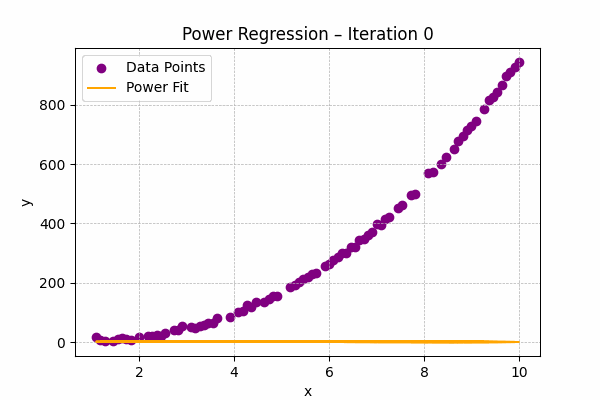
Used when one variable changes at a rate proportional to a power of another, often found in physics or engineering.
Sine Regression
Formula: $y = a\sin(bx + c) + d$
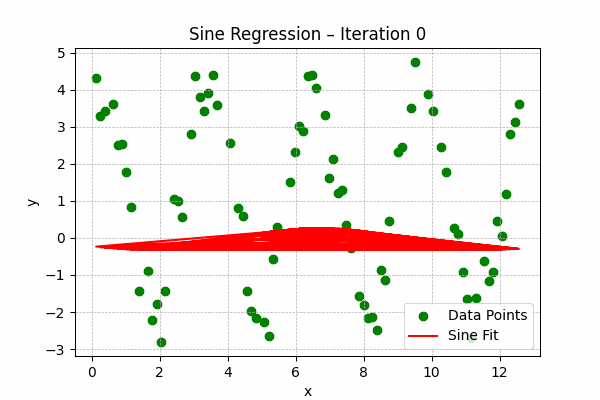
Best for periodic or oscillatory data, such as seasonal trends or sound waves.
Example Applications
Exponential Model: Predicting population growth.
Sine Model: Modeling temperature cycles or light intensity.
Selecting the Appropriate Model
The choice of model depends on data patterns:
- Quadratic: One curve, either concave up or down.
- Cubic: Multiple bends or inflection points.
- Exponential: Rapid growth or decay.
- Power: Steady increase/decrease at a variable rate.
- Sine: Repetitive, periodic trends.
Least Squares Method – Linear Regression
The least squares method is used to find the line of best fit (regression line) for a set of data. This line minimizes the sum of the squares of the vertical distances (errors) between the observed values and the values predicted by the line.
Line of best fit: \( y = mx + c \)
Formulas:
- Slope: \( m = \dfrac{n\sum xy – \sum x \sum y}{n\sum x^2 – (\sum x)^2} \)
- Intercept: \( c = \dfrac{\sum y – m\sum x}{n} \)
Example
Given the following data, find the least squares regression line:
x | y |
---|---|
1 | 2 |
2 | 3 |
3 | 5 |
4 | 4 |
5 | 6 |
▶️ Answer/Explanation
\[ \sum x = 1+2+3+4+5 = 15,\quad \sum y = 2+3+5+4+6 = 20 \]
\[ \sum x^2 = 1^2 + 2^2 + 3^2 + 4^2 + 5^2 = 55,\quad \sum xy = (1)(2) + (2)(3) + (3)(5) + (4)(4) + (5)(6) = 69 \]
Number of data points: \( n = 5 \)
The least squares regression line is: \[ \boxed{y = 0.9x + 1.3} \]
In the Context of AI
In AI and machine learning, regression techniques help model relationships and make predictions. Non-linear regression is essential for capturing complex patterns that linear models miss.
Exam Tip
Use graphing calculators or software like Desmos or Excel to fit different regression models and assess which best suits the data. Visual pattern recognition is key.
SUM OF SQUARE RESIDUALS (\(\text{SS}_{\text{res}}\))
The Sum of Square Residuals (\(\text{SS}_{\text{res}}\)) measures the total deviation of the observed values from the predicted values by the regression model. It is used to assess the fit of the model.
The formula for \(\text{SS}_{\text{res}}\) is:
$ \text{SS}_{\text{res}} = \sum_{i=1}^{n} (y_i – \hat{y}_i)^2 $
Where:
- \(y_i\) is the observed value
- \(\hat{y}_i\) is the predicted value from the regression model
A smaller \(\text{SS}_{\text{res}}\) indicates a better fit of the model to the data, meaning the predictions are closer to the observed values.
The observed and predicted values for a regression model are given below:
- At \( x = 1 \), observed \( y = 2 \), predicted \( \hat{y} = 2.1 \)
- At \( x = 2 \), observed \( y = 3 \), predicted \( \hat{y} = 2.8 \)
- At \( x = 3 \), observed \( y = 5 \), predicted \( \hat{y} = 4.9 \)
▶️ Answer/Explanation
Use the formula for the sum of squared residuals:
$ \text{SS}_{\text{res}} = \sum (y_i – \hat{y}_i)^2 $
Conclusion: The total sum of squared residuals is \( \text{SS}_{\text{res}} = 0.06 \), indicating that the model predictions are close to the observed values.
COEFFICIENT OF DETERMINATION (R²)
The coefficient of determination (R²) is a statistical measure that explains how well the regression model accounts for the variance in the dependent variable.
The formula for \(R^2\) is:
$R^2 = 1 – \frac{\text{SS}_{\text{res}}}{\text{SS}_{\text{tot}}}$
Where:
- \(\text{SS}_{\text{res}}\) is the sum of squared residuals (as defined above)
- \(\text{SS}_{\text{tot}}\) is the total sum of squares, defined as:
$\text{SS}_{\text{tot}} = \sum_{i=1}^{n} (y_i – \bar{y})^2$
Where:
- \(y_i\) is the observed value
- \(\bar{y}\) is the mean of the observed values
Note: \(R^2\) values range from 0 to 1. An \(R^2\) of 1 indicates a perfect fit (\(\text{SS}_{\text{res}} = 0\)), while an \(R^2\) of 0 means that the model does not explain any of the variability in the data.
Interpreting \(R^2\)
An \(R^2\) of 0.95 means that 95% of the variance in the dependent variable can be predicted from the independent variable(s). For linear models, \(R^2\) is the square of Pearson’s correlation coefficient.
Note:
It’s a common mistake to believe that a higher \(R^2\) automatically means a better model. This isn’t necessarily true, particularly when the models being compared vary in complexity or type.”
Limitations of \(R^2\)
While \(R^2\) is helpful, it has limitations:
- \(R^2\) increases when more variables are added to the model, even if they are irrelevant.
- It does not indicate whether the coefficients are biased.
- It does not assess the appropriateness of the model type.
Model Evaluation Beyond \(R^2\)
To fully evaluate a regression model, consider:
- Residual plots: Look for patterns that might indicate a poor fit.
- Domain knowledge: Does the model make sense given the problem context?
- Simplicity: Prefer simpler models when performance is comparable (Occam’s Razor).
- Predictive power: Test the model on new data to assess its generalizability.
Example
Consider data on bacterial colony growth over time:
- Linear Model: \( y = 2x + 5, \, R^2 = 0.85 \)
- Exponential Model: \( y = 5e^{0.2x}, \, R^2 = 0.98 \)
While the exponential model has a higher \(R^2\), we should evaluate whether exponential growth is appropriate for the biological process (e.g., bacterial growth). An overly complex model might lead to overfitting.
A regression model is used to predict values of \( y \). The total sum of squares is given as \( \text{SS}_{\text{tot}} = 5.00 \), and the sum of squares of residuals is \( \text{SS}_{\text{res}} = 0.75 \).
▶️ Answer/Explanation
The coefficient of determination is given by the formula:
$ R^2 = 1 – \frac{\text{SS}_{\text{res}}}{\text{SS}_{\text{tot}}}$
$ R^2 = 1 – \frac{0.75}{5.00} = 1 – 0.15 = \boxed{0.85} $
Interpretation: The model explains 85% of the variation in the dependent variable.
TECHNOLOGY IN NON-LINEAR REGRESSION
Modern tools like R, Python, and statistical software can efficiently perform non-linear regression:
- Automated model fitting for different functions
- Calculation of \(R^2\) and other fit measures
- Visualization of data and fitted models
- Residual analysis
Exam Technique
When determining the regression equation:
- Plot the Data: Visualize the relationship with a scatter plot.
- Choose a Model: Based on the trend, decide on the regression type.
- Use Least Squares: Fit the curve by minimizing \(\text{SS}_{\text{res}}\).
- Evaluate Fit: Compute \(R^2\) for accuracy.
- Validate Predictions: Check residual plots for patterns.
Tip: Familiarize yourself with at least one statistical software or programming language to perform non-linear regression analysis effectively.
Understanding Overfitting in Non-Linear Regression
Overfitting occurs when the model becomes too complex, fitting the noise in the data instead of the actual trend. This results in high \(R^2\) values for training data but poor predictive performance on new data.
Signs of overfitting:
- The model includes unnecessary higher-degree terms.
- The regression curve passes through almost all data points but fails to generalize.
- Residual plots show erratic or systematic patterns instead of random scatter.
To prevent overfitting:
- Use cross-validation to test the model on unseen data.
- Prefer simpler models when performance is similar (Occam’s Razor).
- Consider the context: Real-world relationships are often simpler than overly complex models.