Spearman’s Rank Correlation Coefficient (rₛ)
Spearman’s rank correlation coefficient (denoted as $r_s$) is a non-parametric measure of correlation that assesses how well the relationship between two variables can be described using a monotonic function (i.e., as one variable increases, the other tends to increase or decrease).

$r_s = 1 – \frac{6 \sum d_i^2}{n(n^2 – 1)}$
$d_i$ = difference between the ranks of corresponding variables
$n$ = number of data pairs
Interpreting Spearman’s rₛ
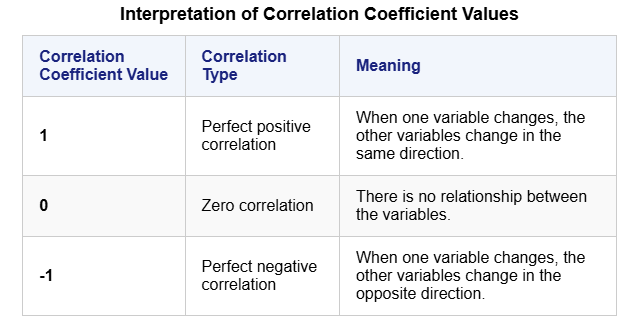
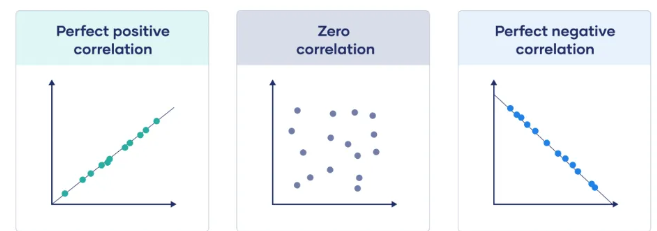
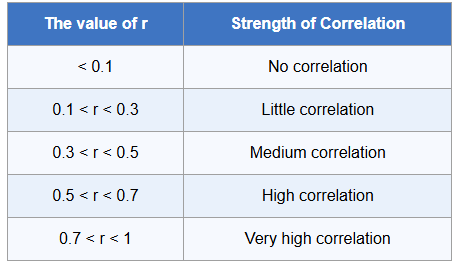
The value of Spearman’s rank correlation coefficient ranges from $-1$ to $+1,$ and its interpretation is based on the strength and direction of a monotonic relationship:
Notice: Also consider p-values and scatterplots to confirm significance.
Example
The table below shows the rankings of 6 students in two subjects: Math and English.
The table below shows the rankings of 6 students in two subjects: Math and English.
| Student | Math Rank (X) | English Rank (Y) | d = X – Y | d² |
|---|---|---|---|---|
| A | 1 | 2 | -1 | 1 |
| B | 2 | 1 | 1 | 1 |
| C | 3 | 4 | -1 | 1 |
| D | 4 | 3 | 1 | 1 |
| E | 5 | 5 | 0 | 0 |
| F | 6 | 6 | 0 | 0 |
▶️ Answer/Explanation
Solution:
Calculate the sum of squared differences:
\( \sum d^2 = 1 + 1 + 1 + 1 + 0 + 0 = 4 \)
Number of data pairs: \( n = 6 \)
Spearman’s rank correlation coefficient:
\( r_s = 1 – \frac{6 \sum d^2}{n(n^2 – 1)} = 1 – \frac{6 \times 4}{6(36 – 1)} = 1 – \frac{24}{210} = 1 – 0.1143 = \rm{0.8857} \)
Interpretation: Since \( r_s \approx 0.89 \), there is a strong positive correlation between the students’ rankings in Math and English.
GDC Example – Spearman’s Rank Correlation Coefficient
Data: The table below shows two variables, X and Y, representing the performance of 7 students in two different subjects.
Data: The table below shows two variables, X and Y, representing the performance of 7 students in two different subjects.
| Student | X (Math Score) | Y (Physics Score) |
|---|---|---|
| A | 85 | 82 |
| B | 78 | 75 |
| C | 92 | 88 |
| D | 70 | 74 |
| E | 88 | 90 |
| F | 76 | 70 |
| G | 80 | 78 |
▶️ Answer/Explanation
1. Press STAT → Edit
2. Enter
3. Use a ranking tool or sort to create ranked lists (L3 = rank(L1), L4 = rank(L2)) — on Casio, use the Statistics mode to rank data directly.
4. Calculate d = L3 − L4 and then d² in another list.
5. Use the formula:
\( r_s = 1 – \dfrac{6 \sum d^2}{n(n^2 – 1)} \)
On TI-Nspire or Casio ClassPad, there is a built-in Spearman rank correlation feature:
Choose your two lists and press OK.
Result on GDC:
\( r_s ≈ 0.964 \) → strong positive correlation between math and physics scores.
2. Enter
X values into L1, Y values into L23. Use a ranking tool or sort to create ranked lists (L3 = rank(L1), L4 = rank(L2)) — on Casio, use the Statistics mode to rank data directly.
4. Calculate d = L3 − L4 and then d² in another list.
5. Use the formula:
\( r_s = 1 – \dfrac{6 \sum d^2}{n(n^2 – 1)} \)
On TI-Nspire or Casio ClassPad, there is a built-in Spearman rank correlation feature:
MENU → Statistics → Regression → Spearman RankChoose your two lists and press OK.
Result on GDC:
\( r_s ≈ 0.964 \) → strong positive correlation between math and physics scores.
Interpretation: There is a strong positive monotonic relationship between student performance in math and physics. As math scores increase, physics scores tend to increase as well.