Venn Diagrams
A Venn diagram is a diagrammatic representation of two or more sets.Used to visually represent sets and their relationships.
Universal Set (\( S \)):Contains all possible elements under consideration.
Example:
Let \( S = \{a, b, c, d, e, f, g, h, i, j\} \),
\( A = \{a, b, c, d, e\} \)
\( B = \{d, e, f, g\} \)
Venn Diagram: 
Key:
\( n(S) = 10 \) (total elements)
\( n(A) = 5 \), \( n(B) = 4 \)
Set Operations
1. Complement (\( A’ \) or \( \overline{A} \))

Elements not in \( A \).
\( A’ = \{f, g, h, i, j\} \).
2. Union (\( A \cup B \))

All elements in \( A \) or \( B \).
\( A \cup B = \{a, b, c, d, e, f, g\} \).
3. Intersection (\( A \cap B \))

Elements common to both \( A \) and \( B \).
\( A \cap B = \{d, e\} \).
$ n(A \cup B) = n(A) + n(B) – n(A \cap B) $
Here: \( 7 = 5 + 4 – 2 \).
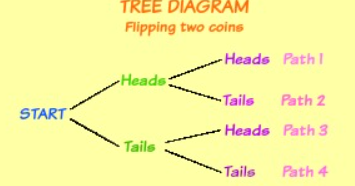
Tree Diagrams
A probability tree diagram is a visual representation that helps organize and calculate the probabilities of two or more dependent or independent events.
It clearly shows all possible outcomes and the paths that lead to them.
Structure of a Tree Diagram:
- First Event:
- Starts at a single point (the root).
- Branches represent each possible outcome.
- Probabilities are written on the branches.
- Subsequent Events:
- Each outcome from the first event branches into the next set of outcomes.
- Continue this process for all events.
- Final Outcomes:
- The ends of the branches represent combined outcomes.
- Multiply probabilities along each path to find the joint probability.
Key Properties:
- The sum of probabilities on branches from the same point = 1.
- Probabilities can be expressed as fractions, decimals, or percentages.
- For independent events, probabilities along the branches are multiplied.
Example A game is played where one of 10 letters is picked. Draw tree diagram .
▶️Answer/ExplanationSolution: The distribution is: A appears 4 times → $P(A) = \frac{4}{10} = 0.4$
We play this game twice. Two A’s: $P(AA) = 0.16$
|


Sample Space Diagram
A sample space diagram lists all possible outcomes of an experiment and is useful for calculating probabilities.

Example Each coin has 2 possible outcomes: Heads (H) Tails (T) Find the probability of getting two tails ▶️Answer/ExplanationSolution: To find the probability of getting two tails, we list all combinations using a sample space diagram:
Total Outcomes: HH, HT, TH, TT There are 4 outcomes in total. $P(\text { two tails })=\frac{1}{4}$ |

Combined Events
Combined events in probability are events that occur at the same time or in succession. We can calculate the likelihood of a certain combination of outcomes.
Remember the basic property for combined events
$
n(A \cup B) = n(A) + n(B) – n(A \cap B)
$
If we divide all terms by the TOTAL, we obtain:
$
P(A \cup B) = P(A) + P(B) – P(A \cap B)
$
Example Consider the Venn diagram where the total number of elements is 100:
Find $P(A \cup B) ?$ and Venn diagram contain probabilities ▶️Answer/ExplanationSolution: In region A only: 20 Then: $ Also: $ Clearly: $ $ A Venn diagram may also contain probabilities instead of numbers of elements. The Venn diagram above then takes the form:
|


Mutually Exclusive (Disjoint) Sets
Two sets are mutually exclusive if they have no common elements:
$ A \cap B = \emptyset $
Example: \( A = \{1, 2\} \), \( B = \{3, 4\} \).
In this case only
If \( A \) and \( B \) are disjoint:
$ n(A \cup B) = n(A) + n(B) $
$ P(A \cup B) = P(A) + P(B) $
Conditional Probability
The conditional probability of an event A, given that event B has occurred, is:
$
P(A|B) = \frac{P(A \cap B)}{P(B)}
\quad \text{provided } P(B) \ne 0
$
It represents the probability of A occurring under the condition that B is known to have occurred.
Intuitive Idea
$P(A)$ is the probability of A in the whole sample space.
$P(A|B)$ is the probability of A within the part of the sample space where B has occurred.
Example Let the universal set have 100 elements:
Find $P(A|B)$ ▶️Answer/ExplanationSolution: Then: $ Also: $ |

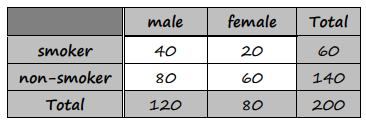
Example Study the given table.
Find: $P(\text{smoker}) = ?$ ▶️Answer/ExplanationSolution: $P(\text{smoker}) = \frac{60}{200} = 0.3$ |
Key Formula
$
P(A \cap B) = P(A|B) \cdot P(B)
$
This formula is often used to find joint probability from conditional probability.
Independent Events
Events A and B are independent if:
$
P(A|B) = P(A)
\quad \text{or} \quad
P(B|A) = P(B)
$
This means the occurrence of B does not affect the probability of A (and vice versa).
Equivalent Condition
$
P(A \cap B) = P(A) \cdot P(B)
$
This is often the most useful way to test whether two events are independent.

Example Consider the following venn diagram.
A and B are independent? ▶️Answer/ExplanationSolution: $P(A) = \frac{30}{120} = \frac{1}{4}$ Then: $P(A|B) = \frac{10}{40} = \frac{1}{4} = P(A)$ So A and B are independent. |

Example Given: $P(A) = 0.4$, Find $P(B)$: ▶️Answer/ExplanationSolution: $ |
Probabilities With and Without Replacement
When calculating probabilities across multiple events, it is important to distinguish between with replacement and without replacement situations. This affects whether events are independent or dependent, and how the total number of outcomes changes.
With Replacement
After each selection, the item is replaced back into the original set.
The total number of items remains constant.
Events are independent (the outcome of one event does not affect the next).
Example With Replacement: A bag contains 3 red balls and 2 blue balls. A ball is selected twice, with replacement. Find the probability . ▶️Answer/ExplanationSolution: Total balls = 5 $ Since the ball is replaced, the probabilities remain unchanged for the second draw. $ |
Without Replacement
After each selection, the item is not replaced back into the original set.
The total number of items decreases.
Events are dependent (the outcome of one event affects the next).
Example Without Replacement A bag contains 3 red balls and 2 blue balls. A ball is selected twice, without replacement. Find the probability . ▶️Answer/ExplanationSolution: $ After removing one red ball, 4 balls remain: 2 red and 2 blue. $ $ |