
IBDP Computer Science B2.1 Programming fundamentals HL Paper 2 - New Syllabus
Question
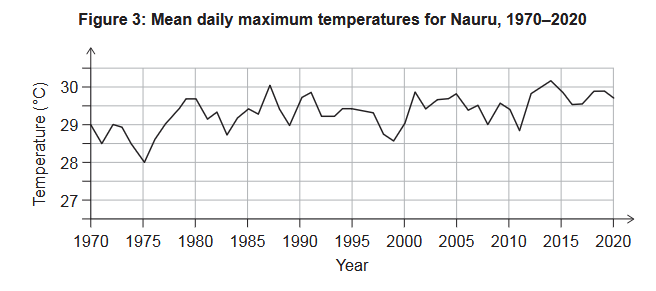
Global warming can be measured over time using mean temperatures. Figure 3 shows the mean daily maximum temperatures from 1970 to 2020 for Nauru, an island in the Pacific Ocean.
An automated system is used to collect the temperature data for Nauru once an hour for one year.
The temperature data is downloaded every day and collated into a master file.
The data from the master file is loaded into a suitable array for that 24-hour period.
The following statistics are calculated:
- Maximum temperature
- Minimum temperature
- Mean temperature
As Nauru is very close to the equator, the length of its day changes very little throughout the year. For the purposes of part (f), the lengths of its day and night are:
- Day: 07:00 to 18:59 inclusive (12 hours)
- Night: 19:00 to 06:59 inclusive (12 hours)
(f) Construct a pseudocode algorithm to calculate the:
- maximum temperature
- minimum temperature
- mean temperature
- mean night-time temperature
Assume the arrays for the time of day of the reading and hourly temperature readings have already been set up and populated as parallel 1D arrays. [8]
Most-appropriate topic code
▶️ Answer/Explanation
(a)
For the correct answer, suitable variables include:
TemperatureReadingDailyMaximumTemperatureTotalTemperature
Only one suitable answer is required.
Explanation: The variables must provide the temperature readings and the value calculated from those readings. The mean can then be calculated from the total temperature and the number of readings.
(b)
For the correct answer:
- Identify/select the data for the mean daily maximum temperatures and the corresponding years.
- Select the appropriate line graph chart type.
- Add the correct chart heading and label the axes as
Temperature (°C)andYear.
Explanation: The years form the horizontal axis and the mean daily maximum temperatures form the vertical axis. A line graph is appropriate because the data represents a measurement changing over time.
(c)
For the correct answer, any two suitable reasons:
- The data is displayed visually, making trends easier to identify.
- The graph shows the increase in mean daily temperatures over time more clearly.
- Data can be compared with similar graphs for different regions or time periods.
- Complicated data is easier to understand when presented visually.
Explanation: A graphical representation allows patterns and trends to be identified more quickly than examining a large collection of numerical values.
(d)
For the correct answer:
- Collecting data once per hour gives 24 recordings per day, compared with 1440 recordings if data were collected once per minute.
- This reduces the amount of processing and storage required, while the small changes occurring between individual minutes may not significantly affect the study.
Explanation: Collecting more frequently produces much more data. If minute-by-minute changes are not important to the investigation, hourly measurements provide sufficient information while reducing storage and processing requirements.
(e)
For the correct answer:
- Create two parallel 1D arrays, such as
TIMEandTEMP, each with a size of 24. - Initialize the
TIMEarray with the 24 hourly times from00:00through23:00. - Use a loop counter, such as
N. - Repeat the process 24 times.
- For each position, identify or display
TIME(N)and store the corresponding temperature inTEMP(N).
Example structure:
TIME[0] = 00:00
TIME[1] = 01:00
TIME[2] = 02:00
...
TIME[23] = 23:00

TEMP[0] = temperature at 00:00
TEMP[1] = temperature at 01:00
TEMP[2] = temperature at 02:00
...
TEMP[23] = temperature at 23:00
Explanation: The arrays are parallel because the same index identifies related values. For example, TIME[5] identifies the time and TEMP[5] stores the temperature recorded at that time.
(f)
For the correct answer:
- Initialize variables for the total temperature and total night-time temperature.
- Initialize
MINandMAXappropriately. - Use a loop that iterates through all 24 readings.
- Add every temperature to the total temperature.
- Compare each temperature with
MINand updateMINif a lower value is found. - Compare each temperature with
MAXand updateMAXif a higher value is found. - Use a selection statement to identify night-time readings and add them to the night-time total.
- Calculate the mean temperature and mean night-time temperature outside the loop.
Example pseudocode:
TOTAL = 0
NIGHT_TOTAL = 0
MIN = 1000
MAX = -1000

loop T from 0 to 23
    NEXT = TEMP[T]

    TOTAL = TOTAL + NEXT

    if TIME[T] >= 19:00 AND TIME[T] < 07:00 then
        NIGHT_TOTAL = NIGHT_TOTAL + NEXT
    end if

    if NEXT < MIN then
        MIN = NEXT
    end if

    if NEXT > MAX then
        MAX = NEXT
    end if
end loop

MEAN_TEMP = TOTAL / 24
MEAN_NIGHT_TEMP = NIGHT_TOTAL / 12
Explanation: The loop processes all 24 hourly readings. Every temperature contributes to the overall total, while only readings belonging to the night period contribute to NIGHT_TOTAL. The minimum and maximum values are updated whenever a smaller or larger temperature is encountered. The two mean values are calculated after the loop because all required readings must first be processed.