D3.2.1 – Production of Haploid Gametes and Formation of Diploid Zygote
🌿 Key Concepts of Sexual Reproduction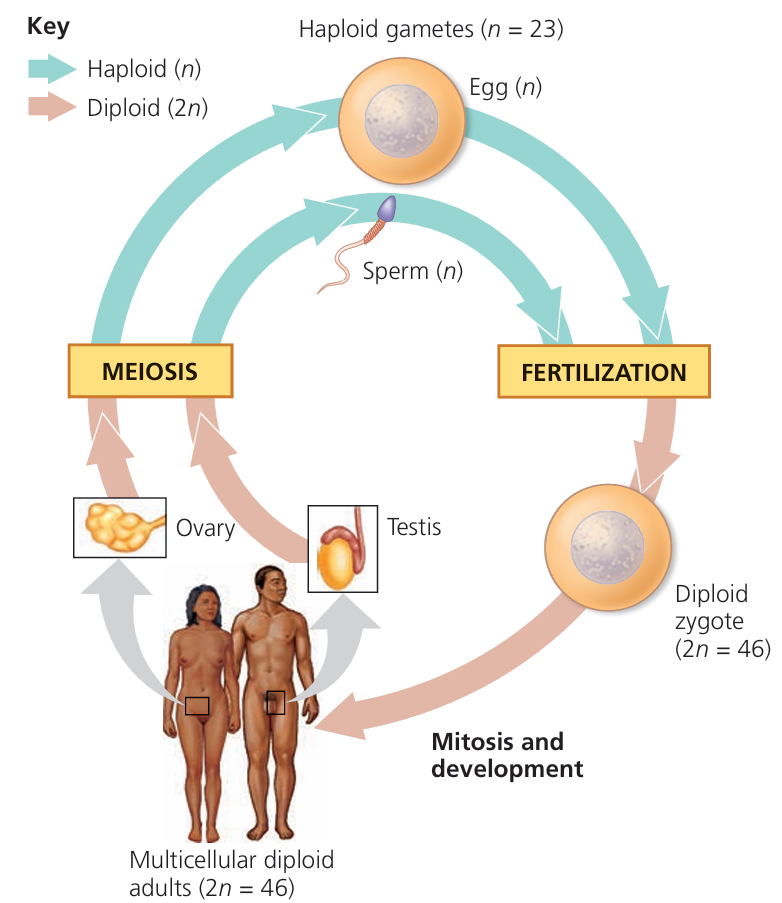
- Haploid gametes (sperm and egg) are produced by parents through meiosis.
- Each haploid gamete contains one copy of each chromosome, so one set of genes.
- When gametes fuse (fertilization), they form a diploid zygote with two copies of each chromosome-one from each parent.
- This process restores the diploid number and is the basis of genetic inheritance.
🌿 Diploid Cells and Genes
- A diploid cell has two copies of each autosomal gene-these are called alleles.
- This means organisms inherit two versions of each gene, one from the mother and one from the father.
- This pattern is common to all eukaryotes with a sexual life cycle (plants, animals, fungi).
🔍 Why This Matters
- Having two alleles allows for genetic variation (dominant/recessive traits).
- It also provides genetic backup if one allele is faulty.
- Sexual reproduction ensures mixing of genetic material, increasing diversity.
| Term | Definition |
|---|---|
| Haploid (n) | Cell with one set of chromosomes (gametes) |
| Diploid (2n) | Cell with two sets of chromosomes (zygote/body cells) |
| Fertilization | Fusion of haploid gametes to form diploid zygote |
D3.2.4 – Phenotype as the Observable Traits Resulting from Genotype and Environment
What is Phenotype?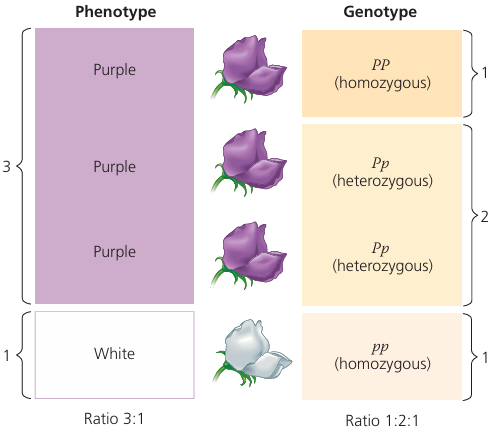
Phenotype: The physical or biochemical traits you can observe in an organism.
It results from the interaction between:
- The genotype (genetic makeup)
- The environment (external factors influencing development)
Examples of Traits
| Type of Trait | Explanation | Example |
|---|---|---|
| Genotype only | Traits controlled almost entirely by genes | Blood group (A, B, AB, O) |
| Environment only | Traits influenced solely by environment | Sun-tanned skin due to exposure to sunlight |
| Genotype × Environment interaction | Traits affected by both genes and environment | Height (genes set potential, nutrition affects final height) |
🌿Details:
- Genetic traits: Eye color, blood type – mainly determined by DNA, not much influenced by environment.
- Environmental traits: Scars, muscle build from exercise — caused by surroundings or lifestyle.
- Combined traits: Skin color can be influenced by genes but also by sun exposure; intelligence has genetic components but also depends on education and environment.
Phenotype = observable traits shaped by genes + environment.
Some traits depend only on genotype, others only on environment.
Most traits, especially complex ones, come from an interaction between the two.
D3.2.5 – Effects of Dominant and Recessive Alleles on Phenotype
🌿 Key Terms
- Alleles: Different versions of the same gene.

- Dominant allele: An allele that shows its effect on the phenotype even if only one copy is present.
- Recessive allele: An allele whose effect on phenotype is masked if a dominant allele is present.
- Homozygous: Having two identical alleles for a gene (e.g., AA or aa).
- Heterozygous: Having two different alleles for a gene (e.g., Aa).
🧬How Alleles Affect Phenotype
- A homozygous dominant (AA) individual has two copies of the dominant allele.
- A heterozygous (Aa) individual has one dominant and one recessive allele.
- Both produce the same phenotype because:
- The dominant allele masks the effect of the recessive allele in heterozygotes.
- One dominant allele is enough to show the dominant trait.
🌿 Examples
| Genotype | Phenotype | Reason |
|---|---|---|
| AA (homozygous dominant) | Displays dominant trait | Two dominant alleles present |
| Aa (heterozygous) | Displays dominant trait | Dominant allele masks recessive one |
| aa (homozygous recessive) | Displays recessive trait | No dominant allele present to mask recessive |
Example: Brown eye color (B) is dominant over blue (b). Genotypes BB and Bb both result in brown eyes.
Dominant alleles show their effect even if only one copy is present.
Recessive alleles only affect phenotype if both alleles are recessive.
Homozygous dominant and heterozygous individuals look the same for that trait.
D3.2.6 – Phenotypic Plasticity: Adaptation by Gene Expression Changes
🌿 What is Phenotypic Plasticity?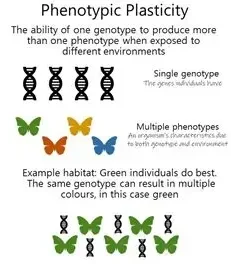
The ability of an organism to change its traits (phenotype) during its lifetime in response to the environment.
Changes happen without altering the genotype (no changes in DNA sequence).
It involves varying patterns of gene expression – some genes turn on/off or change activity depending on conditions.
🌿 Key Features
- Environmental influence: Different environments can cause different phenotypes from the same genotype.
- Reversibility: Changes can often be reversed if the environment changes again.
- Not genetic change: Phenotypic plasticity affects how genes are expressed, not the genes themselves.
🌿 Examples
| Organism | Trait Showing Plasticity | Environmental Trigger |
|---|---|---|
| Arctic fox | Fur color changes between brown (summer) and white (winter) | Seasonal temperature and daylight |
| Plants | Leaf size/thickness adjusts to sunlight levels | Light intensity |
| Humans | Muscle growth with exercise | Physical activity |
Phenotypic plasticity helps organisms adapt quickly to their environment.
It works through gene expression changes, not DNA mutation.
Allows reversible changes to traits within a single lifetime.
D3.2.7 – Phenylketonuria (PKU): A Recessive Genetic Disorder
⚙️ Cause of PKU
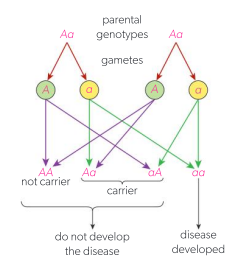
Mutation in the gene coding for phenylalanine hydroxylase enzyme.
This enzyme converts phenylalanine → tyrosine.
Mutation causes enzyme deficiency → phenylalanine builds up.
🧠 Effects on the Body
Excess phenylalanine is toxic to brain development.
Leads to intellectual disabilities and neurological problems if untreated.
👶 Inheritance Pattern
Recessive allele: symptoms appear only if two mutated alleles are inherited.
Carriers (heterozygotes) usually healthy but can pass on the gene.
🍽️ Management
Detected through newborn screening.
Requires a low-phenylalanine diet to prevent toxic buildup.
Early treatment can allow normal development.
PKU is caused by a recessive mutation affecting metabolism.
Untreated PKU causes brain damage, but is manageable.
Example of how genetics influence phenotype and health.
D3.2.10 – Incomplete Dominance and Codominance
⚖️ Inheritance Patterns Beyond Simple Dominance
🧩 Codominance 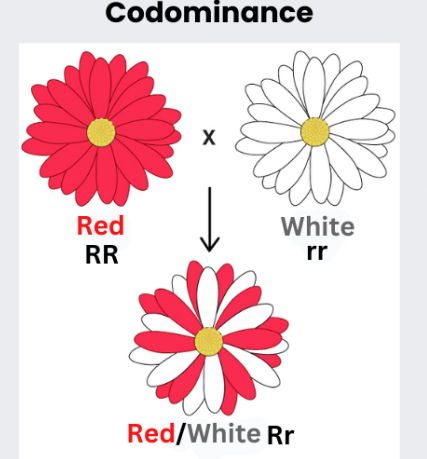
- Both alleles in a heterozygote are fully expressed together.
- The phenotype shows both traits equally (dual phenotype).
- Example: AB blood group (IAIB) – both A and B antigens appear on red blood cells.
- No blending; both alleles’ traits are visible side by side.
🌈 Incomplete Dominance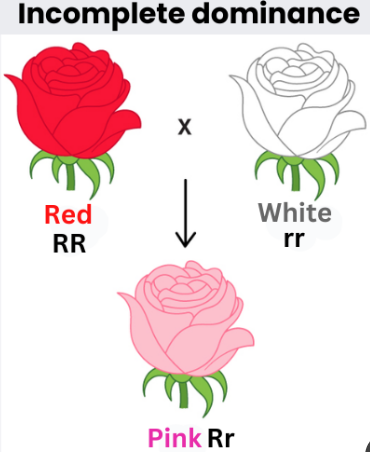
- The heterozygote shows a blend or intermediate phenotype between the two homozygous phenotypes.
- Neither allele is completely dominant over the other.
- Example: Four o’clock flower (Mirabilis jalapa)
- Red-flowered plant (RR) × White-flowered plant (WW) → Pink flowers (RW).
- The heterozygous flowers have a mix of red and white pigments, producing pink.
🔍 Comparing Codominance and Incomplete Dominance
| Feature | Codominance | Incomplete Dominance |
|---|---|---|
| Phenotype in heterozygote | Both traits visible simultaneously (dual) | Intermediate, blended trait |
| Example | AB blood group (IAIB) | Four o’clock flower (pink RW) |
| Trait expression | Both alleles expressed fully | Alleles partially expressed |
Codominance = both alleles show up fully (no blending).
Incomplete dominance = blended phenotype in heterozygotes.
Both differ from simple dominant-recessive inheritance.
D3.2.12 – Haemophilia: A Sex-Linked Genetic Disorder
🔬 What is Haemophilia?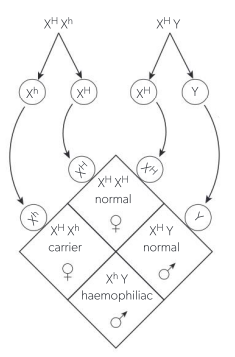
- Haemophilia is a sex-linked recessive disorder affecting blood clotting.
- Caused by a faulty allele on the X chromosome that codes for a clotting factor protein.
- People with haemophilia bleed longer because their blood does not clot properly.
Inheritance of Haemophilia
The gene for haemophilia is located on the X chromosome.
Use notation:
Xᴴ = normal allele (dominant)
Xʰ = haemophilia allele (recessive)
👩👧 Genotypes and Phenotypes
| Genotype | Description | Phenotype |
|---|---|---|
| Females: | ||
| XᴴXᴴ | Homozygous normal | Healthy (no haemophilia) |
| XᴴXʰ | Heterozygous carrier | Healthy but carrier |
| XʰXʰ | Homozygous affected | Haemophilia |
| Males: | ||
| XᴴY | Normal | Healthy |
| XʰY | Affected | Haemophilia |
⚠️ Key Points
- Males are more likely to have haemophilia because they have only one X chromosome.
- A male with the haemophilia allele (XʰY) will have the disorder since there is no second X to mask the faulty gene.
- Females need two copies of the haemophilia allele (XʰXʰ) to express the disorder; otherwise, they are carriers.
- Carrier mothers can pass the haemophilia allele to their sons, who will be affected.
Haemophilia is a classic example of a sex-linked recessive disorder.
It illustrates how gene location on sex chromosomes affects inheritance patterns and disease expression.
D3.2.13 – Pedigree Charts & Genetic Inheritance Patterns
🔍 What Are Pedigree Charts?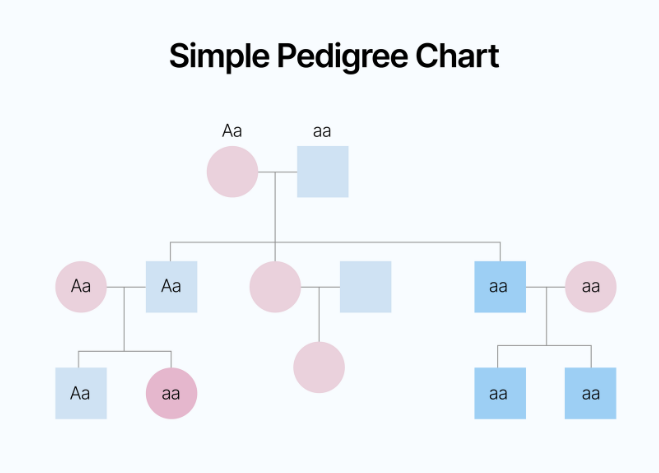
- Diagrams showing the inheritance of traits or disorders across generations in a family.
- Help identify whether a trait is dominant, recessive, sex-linked, or autosomal.
- Used to deduce genotypes of family members based on observed phenotypes.
🧬 Why Use Pedigree Charts?
- To understand how genetic disorders are passed on.
- To identify carriers of recessive or sex-linked disorders.
- To help predict the risk of inheritance in future generations.
🚫 Genetic Basis for Prohibition of Marriage Between Close Relatives
- Close relatives have a higher chance of sharing similar alleles, including harmful recessive alleles.
- Marriage between close relatives increases the risk of offspring inheriting recessive genetic disorders.
- This is a biological reason behind social prohibitions in many cultures.
Inductive vs Deductive Reasoning in Genetics
| Reasoning Type | Explanation | Example in Pedigree Analysis |
|---|---|---|
| Inductive | Drawing general conclusions from specific observations. | Observing some family members with a disorder and proposing a mode of inheritance. |
| Deductive | Applying general principles to predict specific cases. | Using inheritance patterns to deduce genotypes of untested individuals in the pedigree. |
Pedigree charts are powerful tools to trace genetic disorders and inheritance patterns.
Understanding these patterns can inform medical advice and genetic counseling.
Differentiating inductive and deductive reasoning is key to interpreting pedigrees correctly.
D3.2.14 – Continuous Variation & Polygenic Inheritance
🌿 What is Continuous Variation?
- Traits that show a range of phenotypes, not just distinct categories.
- Examples: Skin colour, height, weight in humans.
- These traits usually result from polygenic inheritance (many genes involved) and/or environmental influences.
🧬 Polygenic Inheritance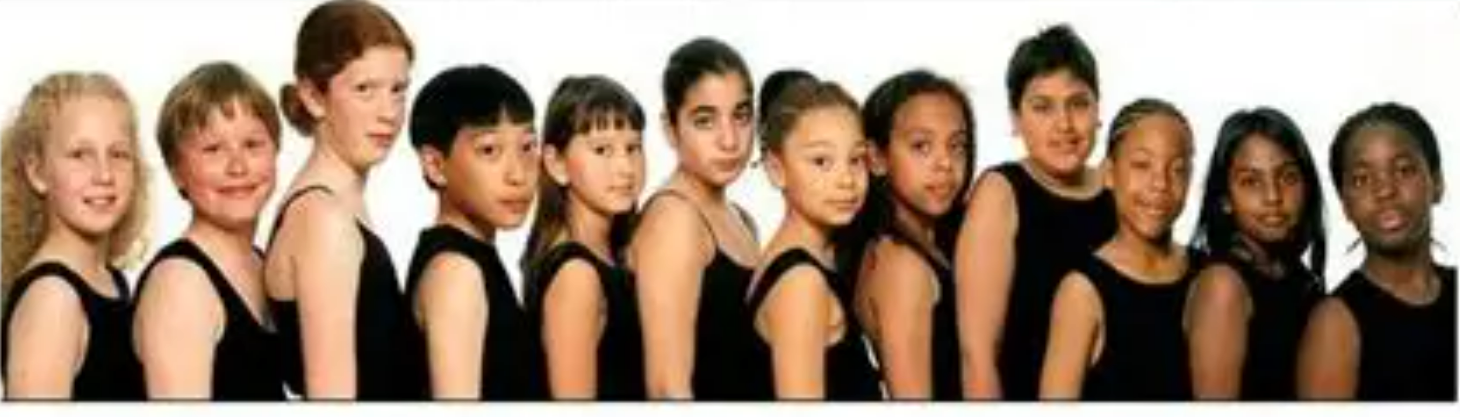
- Multiple genes (polygenes) contribute to the phenotype.
- Each gene adds a small effect.
- Produces a gradual distribution of traits instead of discrete groups.
🌞 Environmental Factors
- Environmental influences (like sunlight exposure for skin colour) modify the expression of polygenic traits.
- Result: Phenotypes can shift within a population due to environment, e.g., tanning.
📊 Continuous vs Discrete Variables
| Feature | Continuous Variation | Discrete Variation |
|---|---|---|
| Example | Skin colour, height | ABO blood group, tongue rolling ability |
| Range of Phenotypes | Many intermediate phenotypes | Distinct categories only |
| Genetic Basis | Polygenic inheritance & environment | Typically single gene with clear alleles |
📏 Application of Skills: Measures of Central Tendency
- Mean: Average value (sum of all values ÷ number of values).
- Median: Middle value when data is ordered.
- Mode: Most frequently occurring value.
- This help summarize data on continuous traits like skin colour measurements.
Continuous variation results from multiple genes and environmental effects.
Traits like skin colour vary in a gradient, not fixed groups.
Understanding continuous vs discrete traits helps in data analysis and interpretation.
Additional Higher Level
D3.2.16 – Segregation and Independent Assortment of Unlinked Genes in Meiosis
🧩 Key Concepts
1. Segregation of Alleles
- During meiosis I, homologous chromosomes separate (segregate) into different gametes.
- Each gamete receives one allele of each gene.
- This explains Mendel’s Law of Segregation.
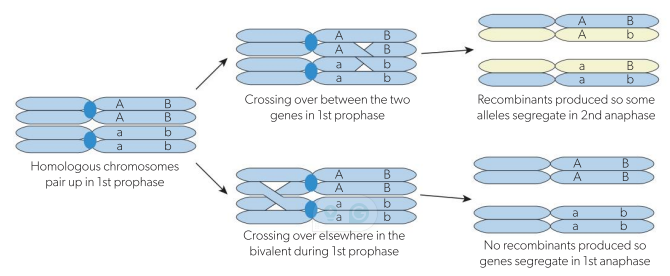
2. Independent Assortment of Unlinked Genes
- Genes located on different chromosomes (unlinked) assort independently.
- The orientation of each pair of homologous chromosomes during meiosis I is random and independent of others.
- Results in many possible combinations of alleles in gametes.
🔄 Link to Dihybrid Crosses
Dihybrid crosses involve two different genes.
For unlinked genes, the alleles assort independently.
This produces a typical 9:3:3:1 phenotypic ratio in the F2 generation when crossing heterozygotes.
🎲 Example
Gene 1: A or a
Gene 2: B or b
During meiosis:
Possible gametes from AaBb individual: AB, Ab, aB, ab
Gametes combine randomly during fertilization → genetic variation.
🔍 Why It Matters
Explains genetic diversity in sexually reproducing organisms.
Helps predict offspring genotypes and phenotypes in genetics.
D3.2.17 – Punnett Grids for Dihybrid Crosses with Unlinked Autosomal Genes
🧩 Key Concepts
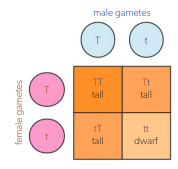
- Purpose of Punnett Grids
Used to predict genotypic and phenotypic ratios in offspring.
Especially helpful in dihybrid crosses involving two genes. - Unlinked Genes
Genes located on different chromosomes or far apart on the same chromosome.
Alleles of these genes assort independently during meiosis.
🔢 Common Ratios from Dihybrid Crosses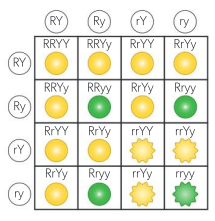
- 9:3:3:1 Phenotypic Ratio
Occurs when crossing two heterozygous parents (AaBb × AaBb).
Phenotypes:- 9 show both dominant traits (A-B-)
- 3 show dominant for gene 1, recessive for gene 2 (A-bb)
- 3 show recessive for gene 1, dominant for gene 2 (aaB-)
- 1 shows both recessive traits (aabb)
- 1:1:1:1 Phenotypic or Genotypic Ratio
Occurs in a cross between a heterozygote and a homozygous recessive (AaBb × aabb).
Equal proportions of the four possible gametes and phenotypes.
🧮 How Ratios Are Derived
- Construct a 4×4 Punnett grid with gametes from each parent:
- For AaBb, gametes: AB, Ab, aB, ab.
- Fill in the grid with combinations.
- Count the genotypes and group into phenotypes.
- Calculate ratios by dividing counts by total offspring number.
⚠️ Important Note (NOS)
These ratios illustrate Mendel’s second law (Law of Independent Assortment).
This law holds true only if:
- Genes are on different chromosomes, or
- Genes are far apart on the same chromosome (recombination frequency ~50%).
There are exceptions, such as linked genes (close together on the same chromosome).
📊 Summary Table Example:
| Genotype | Phenotype | Count | Ratio |
|---|---|---|---|
| A-B- | Both dominant traits | 9 | 9/16 |
| A-bb | Dom. gene 1 only | 3 | 3/16 |
| aaB- | Dom. gene 2 only | 3 | 3/16 |
| aabb | Both recessive | 1 | 1/16 |
D3.2.21 – Using a Chi-Squared Test on Dihybrid Cross Data
🧬What is a Chi-Squared Test?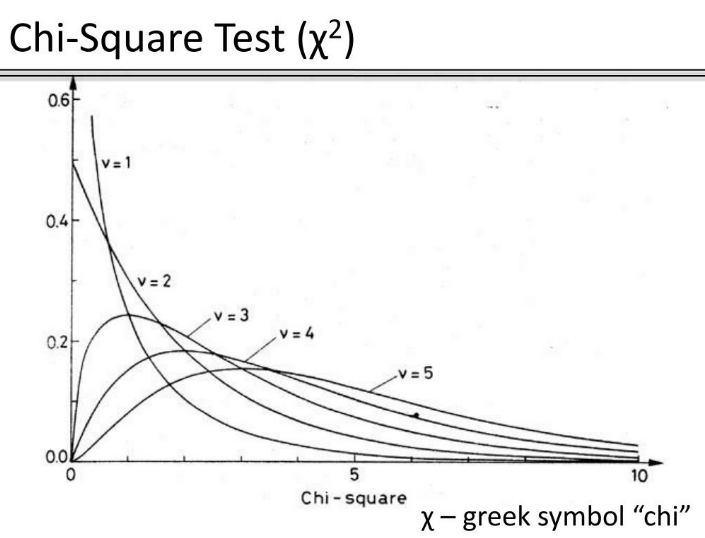
A statistical test used to check if observed experimental results fit the expected results.
Helps determine if differences between observed and expected data are due to chance or something else.
Key Terms:
- Null Hypothesis (H₀): Assumes there is no real difference between observed and expected results (any difference is by chance).
- Alternative Hypothesis (H₁): Assumes there is a real difference between observed and expected results.
How It Works:
Compare the observed data (actual offspring counts from your dihybrid cross) to the expected data (predicted ratios, e.g., 9:3:3:1).
Calculate a chi-squared (χ²) value using:
χ² = ∑ ((O − E)² / E)
where O = observed frequency, E = expected frequency for each category.
Interpreting the Result:
Use a chi-squared table with degrees of freedom (usually number of categories − 1) to find the critical value at the p = 0.05 significance level.
– If χ² is less than the critical value → fail to reject null hypothesis → observed differences are likely due to chance.
– If χ² is greater than the critical value → reject null hypothesis → observed differences are statistically significant (unlikely due to chance).
Statistical significance (p = 0.05): There is a 5% chance that the differences occurred by random chance — this is the cutoff for significance.
The F2 generation data is a sample representing a larger population of offspring.
Results are more reliable when experiments are replicated or repeated