Question
▶️ Answer/Explanation
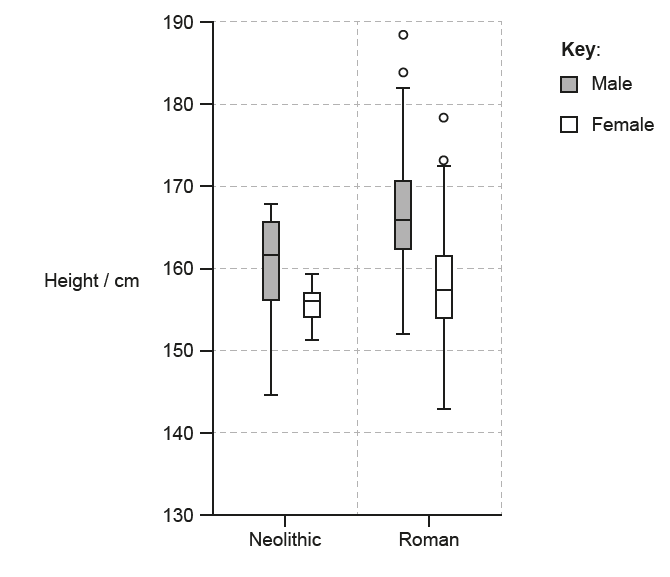
(a)(i)
Estimated median height of Roman-period females is approximately 157 cm.
(Accept values between 156–158 cm.)
(a)(ii)
Maximum height of Neolithic males is around 168 cm.
(Accept values 167–169 cm.)
(a)(iii)
Points outside the whiskers are outliers. These values lie more than 1.5× the interquartile range above the upper quartile.
(b)
Evidence supporting polygenic inheritance:
• Height shows a wide continuous range, not discrete categories.
• Continuous variation is typical of traits controlled by several genes.
Additional consideration:
• Height is also influenced by environmental factors such as diet and health, so the pattern is partially consistent with polygenic inheritance.
(c)
Similarities • Both cause changes in allele frequencies in populations. • Both occur due to environmental pressures acting on phenotypes.
Differences
| Directional selection | Disruptive selection |
|---|---|
| Favours one extreme | Favours both extremes |
| Mean phenotype shifts | Mean phenotype is selected against |
(d)
Key points about the Hardy–Weinberg equation:
• The equation \( p^2 + 2pq + q^2 = 1 \) models genotype frequencies when \( p \) and \( q \) represent allele frequencies.
• Applies to genes with one dominant and one recessive allele.
• Used to predict allele and genotype frequencies in populations.
• Predictions are valid only if allele frequencies remain constant (no evolution).
• Assumes: – a large population, – random mating, – no mutation, migration, or genetic drift, – no natural selection.
Researchers use the equation to determine whether a population is in genetic equilibrium or evolving.