Home / IB DP / IB DP Biology 2026, 2027 & 2028 / Populations and communities Study Notes

IB DP Biology Populations and communities Study Notes | New Syllabus

IB DP Biology Populations and communities Study Notes

IB DP Biology Populations and communities Study Notes

IB DP Biology Populations and communities Study Notes at  IITian Academy  focus on  specific topic and type of questions asked in actual exam. Study Notes focus on IB Biology syllabus with guiding questions of

  • How do interactions between organisms regulate sizes of populations in a community?
  • What interactions within a community make its populations interdependent?

Standard level and higher level: 5 hours

IBDP Biology 2025 -Study Notes -All Topics

C4.1.1 -Populations as Groups of Organisms

🧩Populations

  • Population = group of same species living in one area.
  • Members usually breed with each other.
  • Populations can be small (few) or very large (billions).
  • Often separated by barriers like rivers, mountains, or seas.

🔒 Reproductive Isolation

  • Populations don’t usually mate with other populations.
  • Keeps their genes unique.
  • Example: Groups on different islands don’t mix.

🧩 Population Interactions

  • Competition – for food, space, mates.
  • Cooperation – help each other survive.
  • Predator-prey – prey stay in groups to stay safe.

🦎 Example

  • Lonesome George was the last tortoise of his kind.
  • No mates = not a population.
📝 Summary: A population is a group of the same species living and breeding in an area. They compete and cooperate and stay separate from other populations because they don’t mate outside their group.

C4.1.2 – Estimation of Population Size by Random Sampling

Why estimate population size?

  • Counting every individual is usually impossible or too time-consuming, especially for large populations.
  • So, scientists use estimation methods to find an approximate population size.

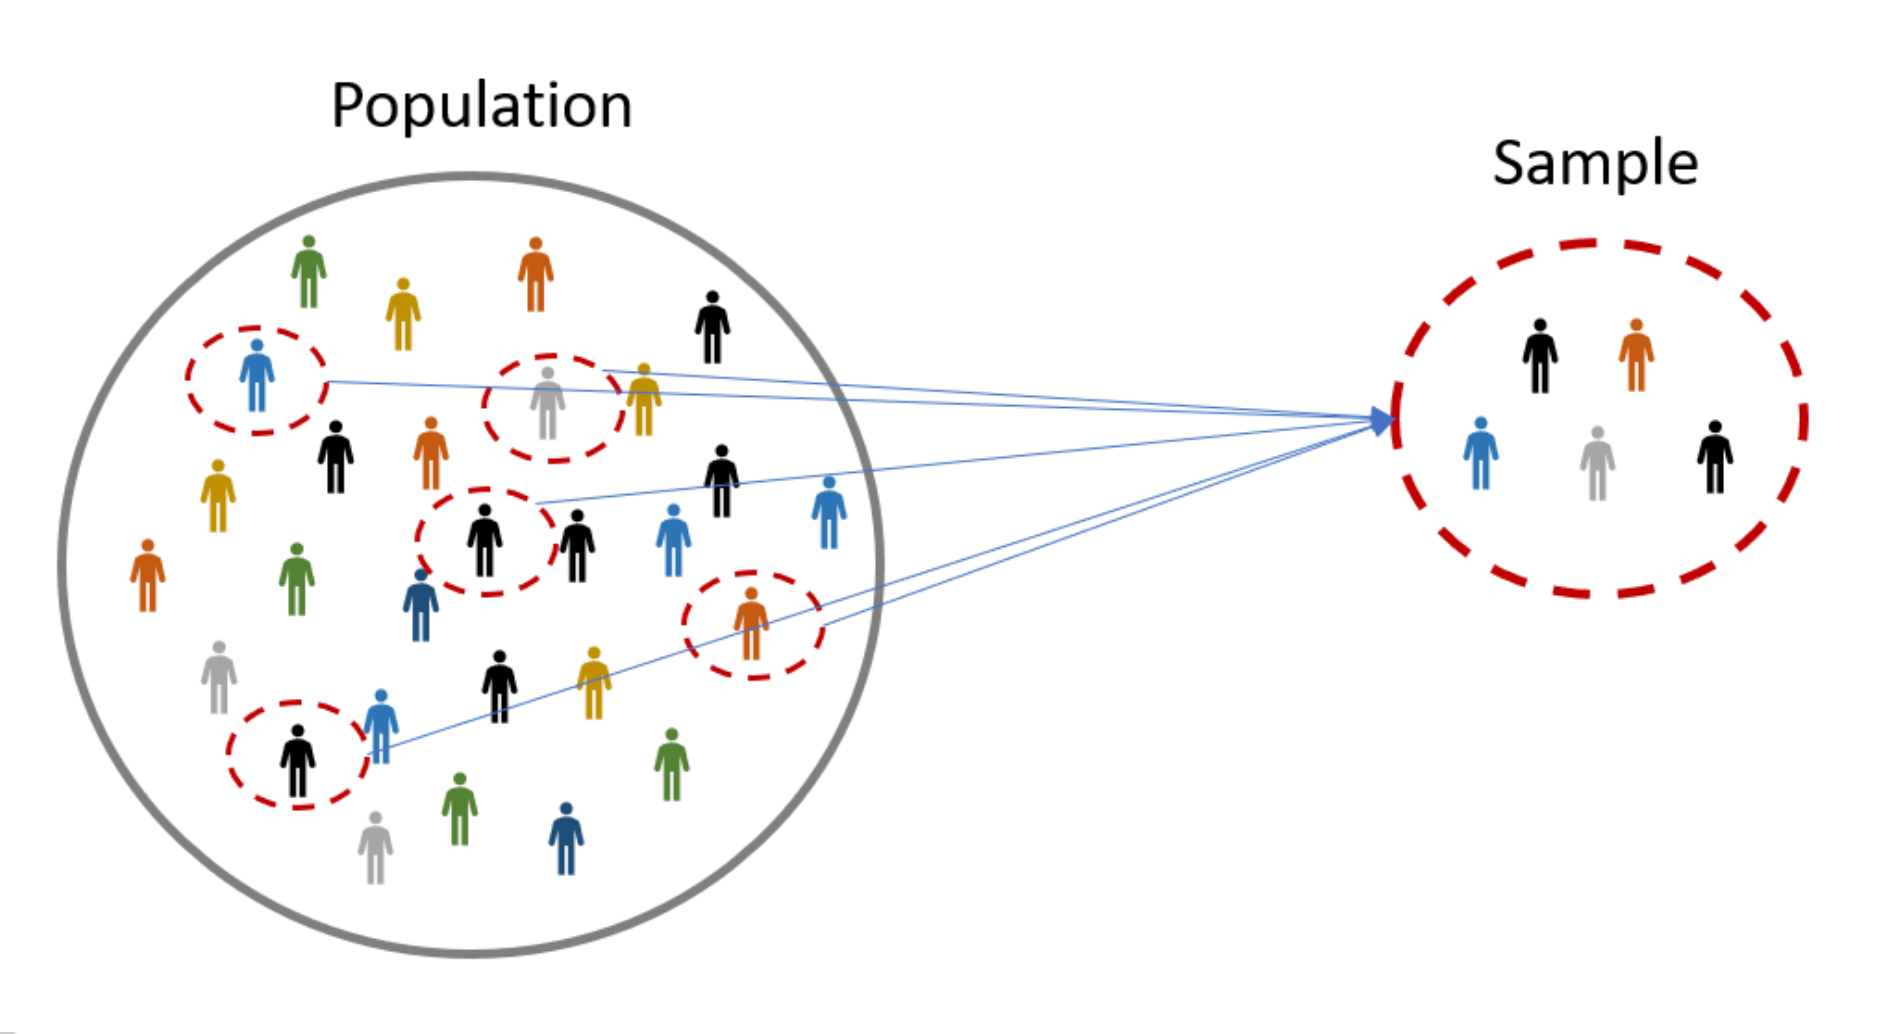
What is random sampling?

  • A method where individuals are chosen randomly, so each one has an equal chance of selection.
  • This helps create a sample that fairly represents the whole population.
  • Randomness avoids bias in the sample selection.

How does it work?

  • Scientists select several random samples from the area.
  • They count individuals in each sample and calculate an average.
  • Using this average, they estimate the total population size.

🔍 Sampling error

  • Estimates are not exact because only a part of the population is counted.
  • The difference between the estimated size and the true population size is called sampling error.
  • Random sampling helps keep this error as small as possible.
📝 Summary:
Population size is estimated by random sampling to save time and avoid counting every individual. Random sampling means picking individuals fairly and randomly to get a good representation, but this can cause small errors called sampling errors.

C4.1.3 – Random Quadrat Sampling for Sessile Organisms

What is quadrat sampling?

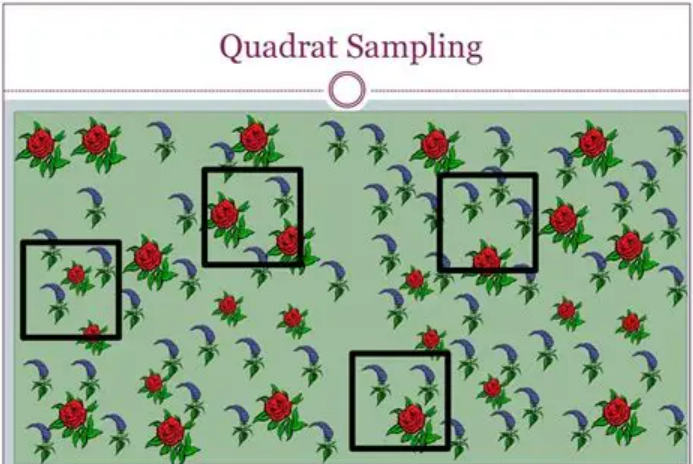
  • A quadrat is a square frame used to mark a small area in a habitat.
  • Placed randomly to avoid bias.
  • Count how many sessile (non-moving) organisms are inside.

When to use it?

  • For organisms that don’t move, like plants, barnacles, or corals.
  • When individuals can be clearly counted.

How does it estimate population size?

  • Count individuals in many random quadrats.
  • Calculate average (mean) number per quadrat.
  • Multiply mean by total quadrats covering whole area.

📊 Standard deviation

  • Tells how much numbers vary between quadrats.
  • Small value means organisms are spread evenly.
  • Large value means clumped or uneven distribution.
📝 Summary:
Quadrat sampling helps estimate numbers of non-moving organisms by counting random small areas. Standard deviation shows how evenly they are spread.

C4.1.4 – Capture-Mark-Release-Recapture & Lincoln Index for Motile Organisms

What is capture-mark-release-recapture?

  • Used to estimate population size of animals that move around (motile).
  • Step 1: Capture some individuals (M), mark them, then release.
  • Step 2: After some time, capture another sample (N).
  • Step 3: Count how many marked individuals are recaptured (R).

Lincoln Index Formula

  • Population size estimate = (M × N) ÷ R
  • M = number marked first time
  • N = number caught second time
  • R = number of marked caught second time

Assumptions of the method

  • No immigration or emigration during study.
  • No births or deaths during study.
  • Marked individuals mix evenly back into the population.
  • Marked and unmarked individuals have equal chance of capture.
  • Marks stay visible and do not affect behavior or survival.
📝 Summary:
Capture-mark-release-recapture estimates population by marking and recapturing animals. The Lincoln index formula calculates size, assuming no change in population and equal catch chance for all.

C4.1.5 – Carrying Capacity and Competition for Limited Resources

What is carrying capacity?

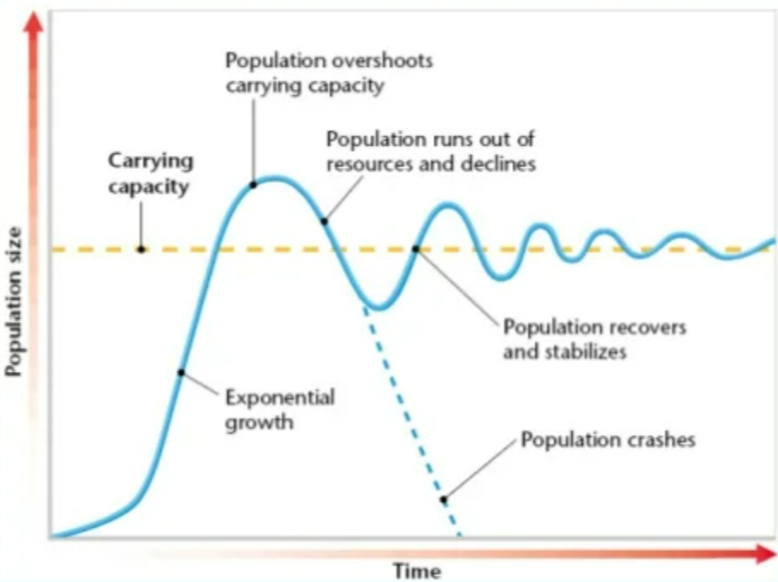
  • The maximum number of individuals an environment can support.
  • When population goes over this, resources run out and competition starts.

Competition for resources

  • Limited resources cause individuals to compete to survive and reproduce.
  • This can lead to more deaths, fewer babies, or animals leaving the area.

Examples of limiting resources

  • For plants: water, light, soil nutrients
  • For animals: food, water, space, breeding sites

Example: Creosote bush population

  • Even with big gaps between bushes, the population is at carrying capacity.
  • Because water is limited, each bush uses all available soil water with its roots.
📝 Summary:
Carrying capacity is the max number of organisms an environment can support. When resources run low, individuals compete, affecting survival and reproduction.

C4.1.6 – Negative Feedback Control of Population Size by Density-Dependent Factors

Population size changes

  • Population numbers go up and down over time.
  • Two types of factors affect this: density-independent and density-dependent.

❌ Density-independent factors

  • Impact populations no matter their size.
  • Examples: natural disasters, weather changes, fires.

⚖️ Density-dependent factors

  • Have bigger effects on larger populations.
  • Include competition for limited resources.
  • Higher risk of predation as population grows.
  • Diseases and pests spread more easily in dense populations.

Negative feedback effect

  • Density-dependent factors help keep population near carrying capacity.
  • When population grows too big, these factors reduce numbers.
  • If population drops too low, the effects lessen, allowing growth again.
📝 Summary:
Density-dependent factors like competition, predation, and disease help control population size by pushing it back toward carrying capacity, creating a balance through negative feedback.

C4.1.7 – Population Growth Curves

What are population growth curves?

  • Graphs showing how population size changes over time.
  • Help us understand growth patterns in ecosystems.

Exponential growth (J-shaped curve)

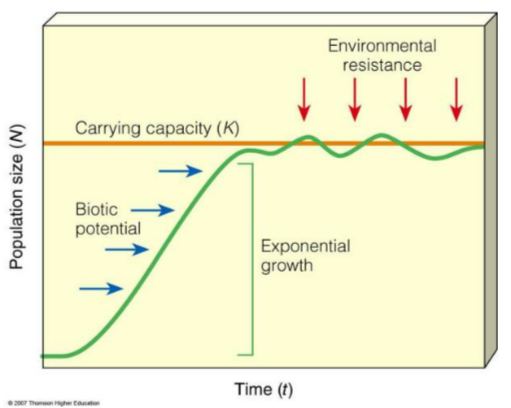
  • Occurs when resources are unlimited.
  • Population grows very fast.
  • No lag phase expected in this model.

⚖️ Logistic growth (S-shaped curve)

  • Growth slows as resources become limited.
  • Population stabilizes at carrying capacity.
  • Limiting factors: competition, predation, disease.

Important notes

  • Population models simplify real complex systems.
  • Graphs often use logarithmic scale for population size (y-axis) and normal scale for time (x-axis).
  • Studying these curves helps in conservation and population management.
📝 Summary:
Population growth curves show how populations grow rapidly at first, then slow and stabilize due to limited resources. Understanding these helps us protect ecosystems.

C4.1.8 – Modelling of the Sigmoid Population Growth Curve

🧪 What is sigmoid growth curve modelling?

  • Studying population growth in controlled experiments.
  • Use organisms that grow quickly and are easy to observe.

Common model organisms

  • Duckweed: Small aquatic plant that reproduces asexually.
  • Grows fast in water, ideal for monitoring population changes.
  • Control factors like light, nutrients, and container size to study carrying capacity.
  • Yeast: Single-celled fungus that reproduces by budding.
  • Used to test effects of temperature, pH, and nutrients on growth.

Why use these models?

  • They reproduce quickly, so population changes are easy to track.
  • Controlled environment helps isolate factors affecting growth.
  • Helps understand real-world population dynamics and growth patterns.
📝 Summary:
Duckweed and yeast are used to model sigmoid population growth in labs. By controlling conditions, scientists study how populations grow and what limits them.

C4.1.9 – Competition versus Cooperation in Intraspecific Relationships

Intraspecific relationships occur between members of the same species. These can involve both competition and cooperation, affecting survival and reproduction.

🔴 Intraspecific competition

  • Occurs when individuals of the same species compete for limited resources.
  • Reasons: scarcity of food, water, mates, nesting sites, or territory.
  • Acts as a density-dependent factor, influencing population size.
  • Examples:
    • Male deer locking antlers to compete for females.
    • Plants of the same species competing for sunlight and soil nutrients.
    • Birds fighting over nesting sites during breeding season.

🟢 Intraspecific cooperation

  • Occurs when members of the same species work together for mutual benefit.
  • Can improve survival, hunting efficiency, or care of offspring.
  • Examples:
    • Wolves hunting in packs to catch larger prey.
    • Meerkats taking turns as sentinels to watch for predators.
    • Penguins huddling together for warmth in cold climates.
📝 Summary:
Intraspecific competition limits population size by reducing access to resources, while cooperation increases chances of survival and reproduction. Many species balance both strategies depending on environmental conditions.

C4.1.10 – A Community as All Interacting Organisms in an Ecosystem

A community includes all populations of different species living and interacting together in an area. This includes plants, animals, fungi, and bacteria.

⚔️ Intraspecific competition

  • Individuals of the same species compete for limited resources like food, water, mates, or territory.
  • This competition drives natural selection, favoring better-adapted individuals.
  • Examples:
    • Plants competing for light.
    • Flowering plants competing for pollinators.
    • Animals competing for food and breeding sites.

🤝Intraspecific cooperation

  • Members of the same species work together to improve survival or reproduction.
  • Examples:
    • Social insects (ants, bees) with division of labor and mutual defense.
    • Cooperative breeding, where individuals help raise offspring that are not their own.
📝 Summary:
Communities contain all interacting species in an area. Within species, competition shapes survival and cooperation improves group success.

C4.1.11 – Interspecific Relationships in Communities

Interspecific relationships are interactions between individuals of different species in a community. These interactions shape biodiversity, species distribution, and ecosystem stability.

🌿 Herbivory

  • A primary consumer feeds on a producer (plants or algae).
  • Important for controlling plant populations and cycling nutrients.
  • Examples: Aphids sucking plant sap, rabbits eating grass, limpets grazing on algae.

🦁 Predation

  • One species (predator) kills and eats another (prey).
  • Helps regulate prey populations and maintain ecosystem balance.
  • Examples: Dingoes hunting kangaroos, starfish eating oysters, lions hunting zebras.

⚔️ Interspecific Competition

  • Different species compete for the same limited resource such as food, space, or light.
  • Can reduce population sizes of competing species.
  • Examples: Barnacles competing for space on rocky shores, trees competing for sunlight in a dense forest.

🤝 Mutualism

  • Both species benefit from the interaction.
  • Often long-term and essential for survival of one or both species.
  • Examples: Nitrogen-fixing bacteria in legume roots, lichens (fungus + algae), coral and zooxanthellae.

🪱 Parasitism

  • One species (parasite) lives on or in another species (host), causing harm.
  • Parasites rely on the host for resources but usually do not kill it quickly.
  • Examples: Ticks feeding on deer blood, tapeworms in intestines, mistletoe growing on trees.

🦠 Pathogenicity

  • A pathogen infects a host, causing disease.
  • Can impact population health and survival rates.
  • Examples: Potato blight fungus infecting plants, tuberculosis bacteria in humans.

📌 Summary:

  • Herbivory: Plant-eating.
  • Predation: Predator kills prey.
  • Interspecific competition: Competing for same resources.
  • Mutualism: Both benefit.
  • Parasitism: Parasite benefits, host harmed.
  • Pathogenicity: Disease-causing interaction.

C4.1.12 – Mutualism: A Win-Win Interspecific Relationship

Mutualism is a close relationship between two different species where both benefit. Usually, the species have different roles or abilities, making the partnership valuable.

🌱 Root Nodules in Fabaceae (Legumes)  

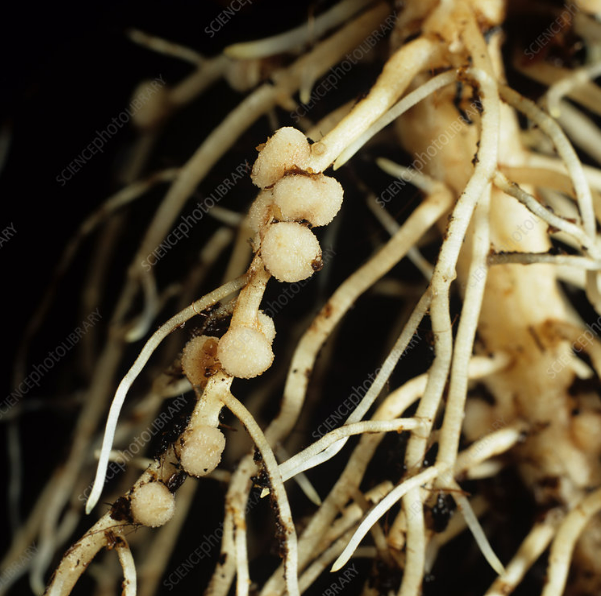
    • Partners: Legume plants and Rhizobium bacteria.
    • Bacteria fix atmospheric nitrogen into a form plant can use.
    • Plants supply bacteria with carbohydrates and a safe home inside root nodules.


🍄 Mycorrhizae in Orchidaceae (Orchids)

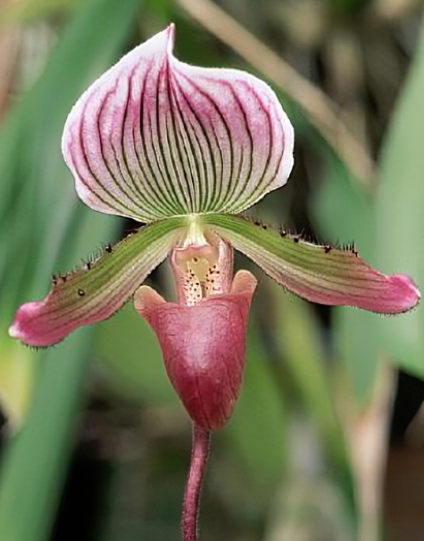
    • Partners: Orchid plants and fungi.
    • Fungi help orchids absorb water and nutrients from soil.
    • Orchids provide fungi with carbohydrates produced by photosynthesis.

🐠 Zooxanthellae in Hard Corals

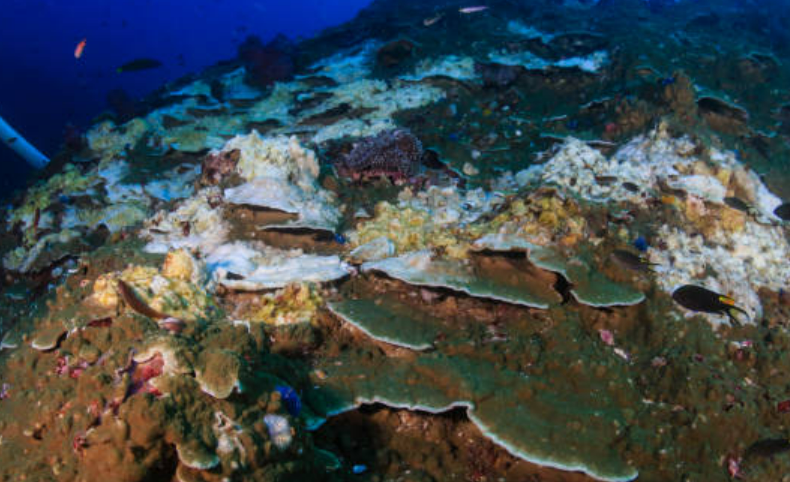
    • Partners: Corals and zooxanthellae (photosynthetic algae).
    • Zooxanthellae photosynthesize, providing nutrients to the coral.
    • Corals offer protection and access to sunlight for algae.


📝 Summary:
Mutualism helps species survive and grow by exchanging essential services or nutrients. Examples include legumes with nitrogen-fixing bacteria, orchids with fungi, and corals with algae.

C4.1.13 – Resource Competition Between Endemic and Invasive Species

When invasive species enter a new environment, they often compete with native (endemic) species for limited resources. This competition can cause native populations to decline or even disappear locally.

Why invasive species succeed

✔️ Lack of natural enemies: No predators or competitors to keep their numbers down.

✔️ Rapid reproduction and spread: High birth rates and efficient ways to move around.

✔️ Competitive advantage: Traits like better resource use or tolerance to tough conditions.

Examples of invasive species

  • Red lionfish: Invades Caribbean and Atlantic waters, outcompeting native fish for food and space.
  • Water hyacinth: Aquatic plant that quickly covers water surfaces, blocking sunlight and lowering oxygen, harming native plants and animals.

Example from India (Local illustration)

  • Lantana camara: An invasive shrub spreading widely in Indian forests.
  • Outcompetes native plants by forming dense thickets.
  • Limits growth of native species by blocking sunlight and taking up water and nutrients.
📝 Summary:
Invasive species can outcompete endemic species for resources due to lack of predators, rapid growth, and competitive traits. Managing their spread is vital to protect native biodiversity.

C4.1.14 – Tests for Interspecific Competition

Interspecific competition happens when different species compete for the same limited resources like food, water, or space. Detecting and testing competition requires different scientific approaches.

How to test for competition?

  • Observation: Monitor species in natural habitats over time to see if their populations affect each other.
  • Laboratory experiments: Controlled conditions to study competition effects on species growth and survival.
  • Field manipulation experiments: Remove one species from an area and observe the impact on the other species.

Statistical tests

  • Chi-squared test: Used to analyze if species distributions are independent or influenced by competition.

Important ecological concepts

  • Competitive Exclusion Principle: Two species cannot occupy the same niche forever; one outcompetes the other.
  • Resource Partitioning: Species reduce competition by using different resources or parts of a resource.
  • Character Displacement: Evolution of traits (like beak size) reduces overlap in resource use between species.

Key points

  • Competition is indicated if one species does better when the other is absent, but this doesn’t prove competition alone.
  • Both experiments and observations are important scientific methods, with differences in control and realism.
📝 Summary:
Tests for interspecific competition use observations, experiments, and statistics. Understanding competition helps explain how species coexist or exclude each other in ecosystems.

C4.1.15 – Use of the Chi-Squared Test for Association Between Two Species

The chi-squared test is a statistical tool used to check if there is an association between the distributions of two species. It helps determine whether the presence of one species affects the presence of another.

📊 How the test works

  • Data is collected on presence or absence of two species across multiple sampling sites (quadrats).
  • Observed frequencies (actual counts) are compared to expected frequencies (what would happen if species were independent).
  • The chi-squared formula calculates a value showing how much observed and expected values differ.
  • If this value is greater than the critical value from chi-squared tables, the null hypothesis of no association is rejected.

Ecological significance

  • A significant result suggests that the two species’ distributions are related, indicating possible ecological interactions such as competition or mutualism.
  • Helps ecologists understand patterns like whether species avoid or prefer co-occurrence.

Important points

  • Requires data from multiple, randomly selected quadrats to avoid bias.
  • Does not prove causation but indicates association.
  • Useful in field studies of population distributions and community ecology.
📝 Summary:
The chi-squared test compares observed vs. expected occurrences of two species to detect associations. It is a key tool for exploring ecological relationships like competition.

C4.1.16 – Predator-Prey Relationships as an Example of Density-Dependent Control of Animal Populations

Predator–prey interactions are a key example of density-dependent population control – where the size of one population influences the size of another. The numbers of predators and prey often show a regular cyclical pattern over time.

How it works

  • When prey numbers rise, predators have more food, so their population increases.
  • As predator numbers grow, they consume more prey, causing the prey population to decline.
  • With fewer prey available, predators face food shortages, leading to a decline in predator numbers.
  • With reduced predation pressure, prey numbers can recover – and the cycle repeats.

Why it’s density-dependent

  • The effect of predation depends on the density (population size) of prey and predators.
  • High prey density supports larger predator populations; low prey density reduces predator numbers.
  • This relationship helps maintain ecological balance.

Case study – Red foxes and mountain hares in Sweden

  • Observation: Long-term data show population cycles in both species.
  • When hare numbers rise → fox population also increases due to abundant food.
  • As fox numbers grow → predation pressure on hares intensifies, reducing hare numbers.
  • With fewer hares → foxes have less food, leading to a decline in their population.
  • The system stabilises until hare numbers recover, starting the cycle again.
📝 Summary:
Predator–prey cycles are a classic example of density-dependent control. In Sweden, red fox and mountain hare populations show linked cycles – predator numbers rise after prey abundance and fall when prey becomes scarce.

C4.1.17 – Top-Down and Bottom-Up Control of Populations in Communities

Populations in ecological communities can be regulated by two main types of control – top-down and bottom-up. Both control mechanisms influence species abundance and ecosystem stability, but usually one dominates in a particular community.

🔝 Top-Down Control

  • Higher trophic levels (predators) regulate the population sizes of lower trophic levels (herbivores and producers).
  • Example: An increase in predator numbers causes a decrease in herbivores, which can lead to an increase in producer (plant) abundance.
  • This cascade effect through the food chain is called a trophic cascade.

⬇️ Bottom-Up Control

  • Lower trophic levels (producers) influence the populations of higher trophic levels.
  • Example: Limited nutrients or resources reduce producer growth, which decreases the populations of herbivores and predators.
  • Resource availability at the base controls the entire food chain.

⚖️ Balance Between Controls

  • Some communities are mainly controlled from the top (predators), others from the bottom (resources).
  • Often, both mechanisms interact to shape population sizes and community structure.
  • Understanding which control dominates helps in ecosystem management and predicting effects of changes like climate shifts or invasive species.
📝 Summary:
Top-down control means predators regulate populations below them; bottom-up control means resource availability regulates populations above. Both influence community dynamics, but usually one is dominant depending on the ecosystem.

C4.1.18 – Allelopathy and Secretion of Antibiotics

Allelopathy and antibiotic secretion are two important chemical strategies used by organisms to reduce competition and defend resources by releasing harmful substances into their surroundings.

🌿 Allelopathy

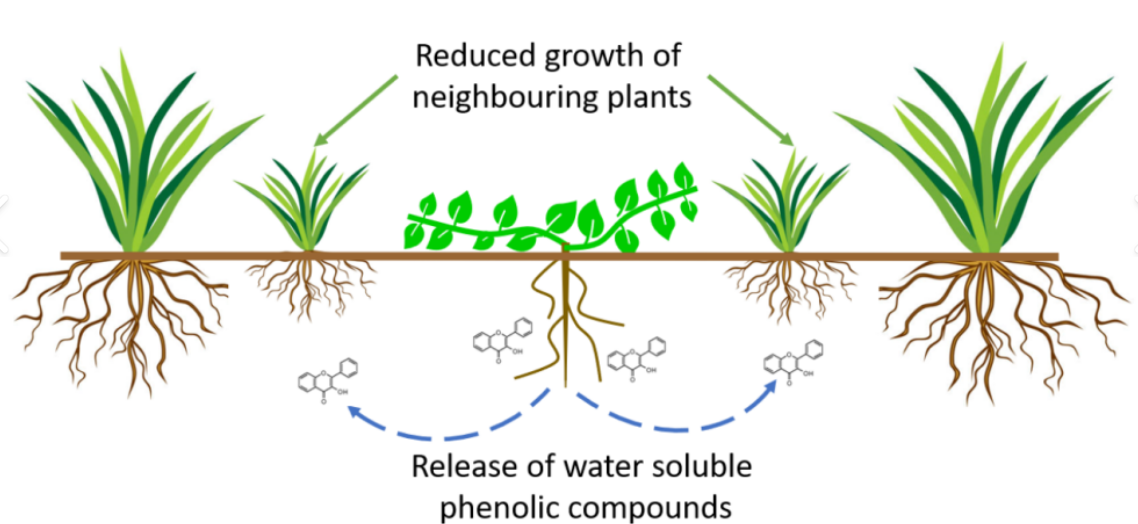
  • Definition: Allelopathy is when plants release chemicals into the soil or air that negatively affect the growth and development of nearby plants.
  • How it works: These chemicals can:
    • Inhibit seed germination
    • Reduce root growth
    • Interfere with nutrient absorption
    • Cause toxicity to neighboring plants
  • Why it matters: By limiting the growth of other plants around them, allelopathic plants reduce competition for water, nutrients, and sunlight.
  • Local Example: Parthenium hysterophorus (commonly called Congress grass), an invasive weed in India, releases allelopathic chemicals into the soil. This suppresses native plants, reducing biodiversity and changing local ecosystems.

🧪 Secretion of Antibiotics

  • Definition: Certain microorganisms like bacteria and fungi produce antibiotics – chemical substances that kill or inhibit the growth of other microorganisms.
  • How it works: Antibiotics target critical cellular processes in bacteria, such as:
    • Inhibiting cell wall synthesis
    • Blocking protein production
    • Disrupting DNA replication
  • Why it matters: Producing antibiotics gives microbes a competitive advantage by reducing the number of competing bacteria or fungi in their environment.
  • Local Example: Streptomyces species, soil bacteria commonly found in India, produce antibiotics like streptomycin that help them outcompete other microbes. These antibiotics are also used in medicine to treat bacterial infections.
📝 Summary:
Both allelopathy and antibiotic secretion are forms of chemical defense. They help organisms compete by releasing substances harmful to others – allelopathy targets plants, while antibiotics target microbes. These processes influence which species survive and shape ecosystem structure.
Scroll to Top