Question
▶️ Answer/Explanation
(a)
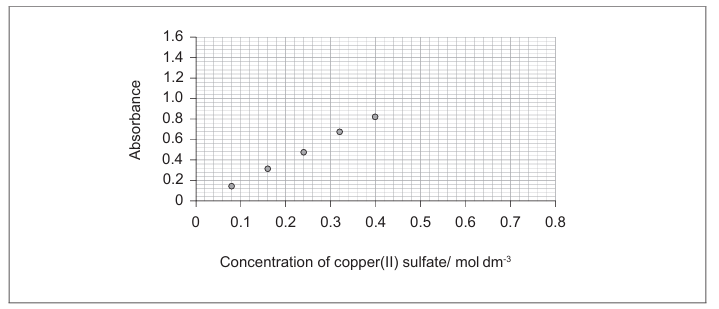
• A reasonable line of best fit that passes through or near all data points ✓
• The line should be extended beyond the range of the measured data (beyond 0.08 AND 0.32 mol dm⁻³) ✓
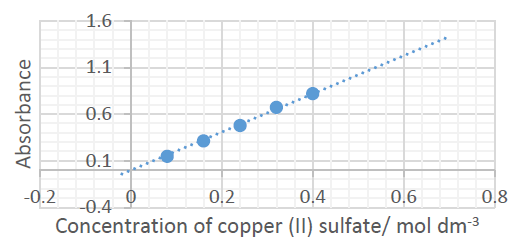
Appropriate line drawn with extrapolation.
(b)
The graph shows that absorbance is directly proportional to concentration.
\(\boxed{\text{Directly proportional}}\)
(c)
A specific wavelength is used because absorbance varies with wavelength, and maximum absorbance occurs at a characteristic wavelength for each substance, allowing for more accurate concentration determination.
\(\boxed{\text{For maximum accuracy in concentration measurement}}\)
(d)
• Gradient = 2.0 (accept range 1.9-2.3) ✓
• Equation: Absorbance = 2.0 × Concentration (y = 2.0x) ✓
\(\boxed{2.0}\) and \(\boxed{A = 2.0C}\)
(e)
Using the equation A = 2.0C: 2.44 = 2.0 × C → C = 1.22 mol dm⁻³
\(\boxed{1.22}\) mol dm⁻³ (accept 1.20-1.30)
(f)
There is no significant difference between using this calibration curve and a theoretical one for determining concentrations.
\(\boxed{\text{No significant difference}}\)
(g)
The wavelength of maximum absorbance for copper(II) sulfate is approximately 635 nm.
\(\boxed{635}\) nm (accept 585-647 nm)