Question
| Trial \(1\) | Trial \(2\) | Trial \(3\) | Trial \(4\) | |
|---|---|---|---|---|
| Final burette reading / \(\text{cm}^{3} \pm 0.05\ \text{cm}^{3}\) | \(26.15\) | \(34.25\) | \(29.30\) | \(32.20\) |
| Initial burette reading / \(\text{cm}^{3} \pm 0.05\ \text{cm}^{3}\) | \(0.00\) | \(10.00\) | \(5.00\) | \(8.00\) |
| Volume of EDTA added / \(\text{cm}^{3}\) | \(26.15\) | \(24.25\) | \(24.30\) | \(24.20\) |
▶️ Answer/Explanation
(a)(i)
The appropriate glassware is a \(250.0\ \text{cm}^{3}\) volumetric flask.
(a)(ii)
One acceptable procedure (any two key steps):
• Use a funnel to transfer the prepared calcium chloride solution quantitatively into a \(250.0\ \text{cm}^{3}\) volumetric flask, avoiding loss of solution.
• Rinse the beaker and funnel with deionized water and add these washings to the flask.
• Add deionized/distilled water until the bottom of the meniscus touches the calibration mark.
• Stopper the flask and invert it several times to mix and homogenize the solution thoroughly.
(b)
Heat the solid \(\text{CaCl}_{2}\) to constant mass to drive off all water, then allow it to cool in a desiccator or under vacuum so that it does not re-absorb moisture.
(c)(i)
Any two valid reasons, for example:
• The initial titration was performed quickly as a rough titration to get an approximate volume, so extra EDTA was added past the end-point.
• Liquid was not filling the burette tip at the start of trial \(1\), so the recorded initial reading of \(0.00\ \text{cm}^{3}\) did not reflect the true volume delivered.
• The burette tap was leaking or the burette/conical flask was contaminated or not rinsed correctly, requiring more EDTA.
• Extra titrant was deliberately added to confirm that the colour change was complete.
(c)(ii)
A value that differs markedly from the others is called an outlier (or anomalous result / rogue value).
(c)(iii)
Trial \(1\) is an outlier and is not concordant with the other three titres. Including it would give a mean volume (and therefore a calculated concentration) that is too high and introduce systematic error.
(c)(iv)
Burette reading uncertainty is \(\pm 0.05\ \text{cm}^{3}\) for each reading, so the volume delivered has total uncertainty \(\pm 0.10\ \text{cm}^{3}\).
Trial \(2\) volume: \(24.25\ \text{cm}^{3}\).
\[ \%\ \text{uncertainty} = \dfrac{0.10}{24.25} \times 100 \approx 0.41\ \%. \]
\(\boxed{0.4\ \% \text{ (to two significant figures)}}\)
(c)(v)
• The red complex \(X\) appears red because it absorbs green light (its complementary colour, wavelength about \(491\text{–}575\ \text{nm}\)).
• The blue ion \(Y\) appears blue because it absorbs orange light (complementary colour, wavelength about \(585\text{–}647\ \text{nm}\)).
• Green light has a shorter wavelength and higher frequency than orange light, so the photons it carries have higher energy.
Therefore, \(X\) absorbs radiation of higher energy than \(Y\).
(d)(i)
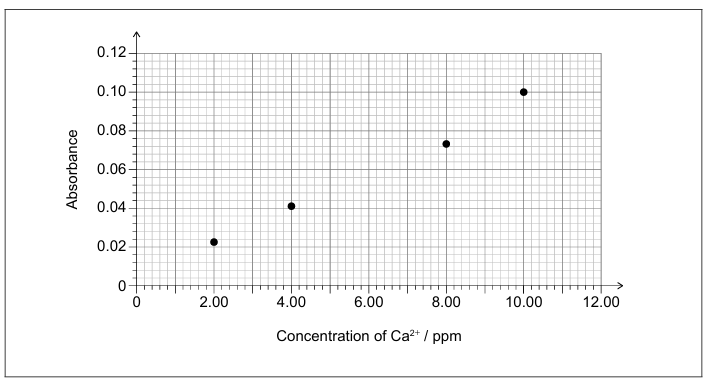
A suitable line of best fit is a straight line (or smooth curve) drawn through the plotted points on the absorbance–concentration graph with roughly equal numbers of points above and below the line, and without extrapolating far beyond the data.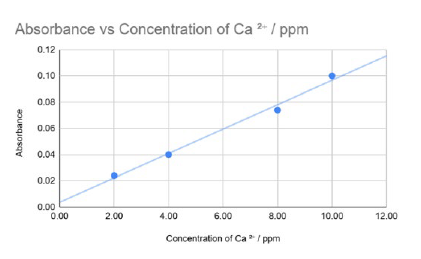
(d)(ii)
Reading from the calibration line at an absorbance of \(0.090\) gives a concentration of about \(\boxed{9.2\ \text{ppm}}\) of \(\text{Ca}^{2+}\).
(Calculation idea: use the straight-line graph to interpolate the corresponding concentration between \(8.00\ \text{ppm}\) and \(10.0\ \text{ppm}\).)
(d)(iii)
Use \[ A = \log_{10}\!\left(\dfrac{I_{0}}{I}\right), \quad A = 0.090. \] First, find the ratio \(\dfrac{I_{0}}{I}\):
\[ \dfrac{I_{0}}{I} = 10^{A} = 10^{0.090} \approx 1.23. \] So \[ \dfrac{I}{I_{0}} = \dfrac{1}{1.23} \approx 0.813. \] This means about \(81.3\ \%\) of the light is transmitted, so the percentage absorbed is \[ 100 – 81.3 = 18.7\ \%. \] \(\boxed{\text{Percentage absorbed} \approx 18.7\ \%}\)
(d)(iv)
Use the dilution relationship \(C_{1} V_{1} = C_{2} V_{2}\).
Here \(C_{2} = 4.00\ \text{ppm}\), \(V_{2} = 25.00\ \text{cm}^{3}\), \(V_{1} = 2.00\ \text{cm}^{3}\).
\[ C_{1} = \dfrac{C_{2} V_{2}}{V_{1}} = \dfrac{4.00 \times 25.00}{2.00} = \dfrac{100.0}{2.00} = 50.0\ \text{ppm}. \] \(\boxed{C_{1} = 50.0\ \text{ppm}}\)
(d)(v)
A concentration of \(4.00\ \text{ppm}\) corresponds to \(4.00\ \text{mg}\) of \(\text{Ca}^{2+}\) per \(\text{dm}^{3}\):
\[ 4.00\ \text{ppm} = 4.00\ \text{mg dm}^{-3} = 4.00 \times 10^{-3}\ \text{g dm}^{-3}. \] The molar mass of calcium is approximately \(40.08\ \text{g mol}^{-1}\).
Moles of \(\text{Ca}^{2+}\) per \(\text{dm}^{3}\): \[ n = \dfrac{4.00 \times 10^{-3}}{40.08} \approx 9.98 \times 10^{-5}\ \text{mol dm}^{-3}. \] \(\boxed{[\text{Ca}^{2+}] \approx 9.98 \times 10^{-5}\ \text{mol dm}^{-3}}\)