Emission Spectra and the Electromagnetic Spectrum
Emission Spectra
When an atom absorbs energy, its electrons are excited to higher energy levels. These excited electrons are unstable and will eventually fall back down to lower energy levels, releasing energy in the form of photons.

This release of energy produces emission spectra — specific patterns of coloured lines observed when light from excited atoms is passed through a prism or diffraction grating.
Key Process:
- Electron absorbs energy → moves to a higher energy level (excited state)
- Electron returns to a lower energy level → emits a photon
- Photon’s energy corresponds to a specific wavelength (colour)

Formula : The energy of emitted radiation is related to frequency by:
\( E = hf \quad \text{and} \quad c = f\lambda \)
- \( E \) = energy (J)
- \( h \) = Planck’s constant = \( 6.63 \times 10^{-34} \, \text{J s} \)
- \( f \) = frequency (Hz)
- \( c \) = speed of light = \( 3.00 \times 10^8 \, \text{m s}^{-1} \)
- \( \lambda \) = wavelength (m)
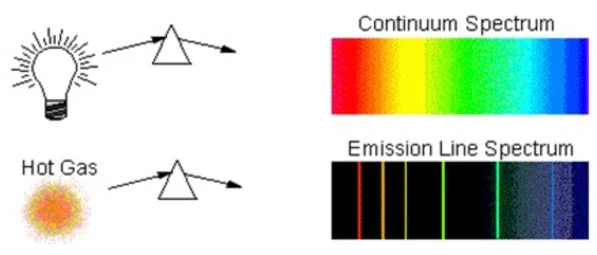
Continuous vs Line Spectra
- Continuous spectrum: Shows a full range of colours or wavelengths (like a rainbow). Produced by white light (e.g., sunlight or heated solid objects).
- Line spectrum: Contains only specific wavelengths. Each element produces a unique pattern — like a fingerprint. Caused by transitions between quantized energy levels in atoms.
Relationship Across the Electromagnetic Spectrum
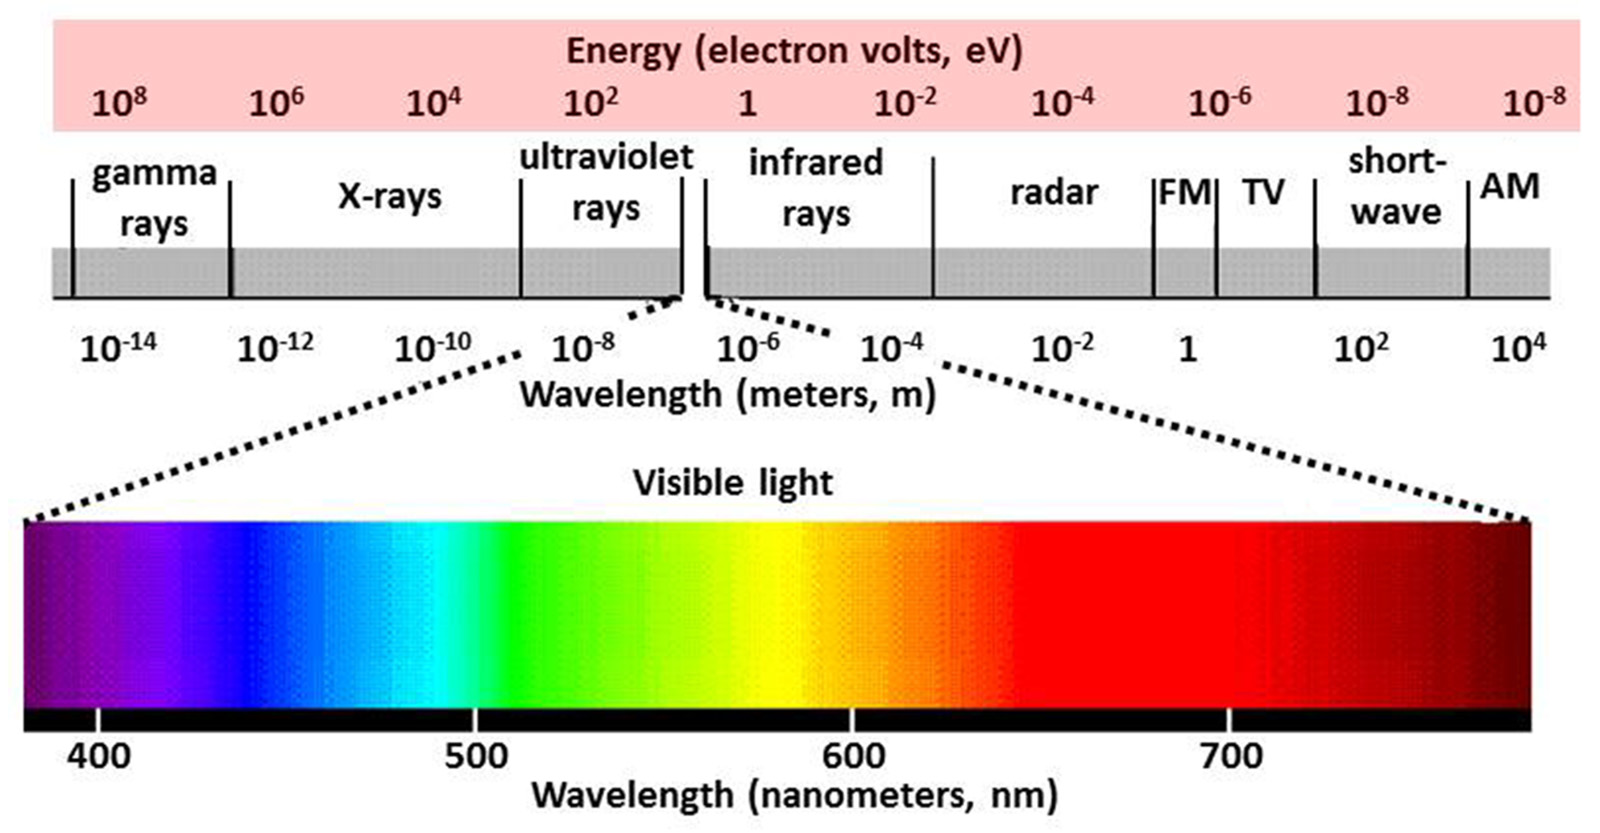
| Type | Wavelength (λ) | Frequency (f) | Energy (E) | Colour (Visible Region) |
|---|---|---|---|---|
| Radio | Long (>1 m) | Low | Low | — |
| Microwave | 1 mm – 1 m | Higher | Low | — |
| Infrared | 700 nm – 1 mm | Higher | Low–moderate | — |
| Visible | 400–700 nm | Medium | Moderate | Violet → Red |
| Ultraviolet | 10–400 nm | High | High | — |
| X-rays | 0.01–10 nm | Very High | Very High | — |
| Gamma rays | < 0.01 nm | Extremely High | Extremely High | — |
Quick Relationships:
- As wavelength decreases → frequency and energy increase
- Colours in the visible spectrum range from:
- Violet (short λ, high f, high E)
- to Red (long λ, low f, low E)
Conceptual Difference:
- Line spectra give evidence for quantized energy levels in atoms.
- Continuous spectra show that light from heated solids contains all wavelengths.
Example
The frequency of visible red light is approximately \( 4.6 \times 10^{14} \, \text{Hz} \). Calculate the energy of a single photon of this light.
▶️Answer/Explanation
Use \( E = hf \):
\( h = 6.63 \times 10^{-34} \, \text{J·s} \),
\( f = 4.6 \times 10^{14} \, \text{Hz} \)
\( E = (6.63 \times 10^{-34})(4.6 \times 10^{14}) = 3.05 \times 10^{-19} \, \text{J} \)
Example
Distinguish between the line emission spectrum of hydrogen and the continuous spectrum of white light.
▶️Answer/Explanation
The hydrogen line spectrum shows specific coloured lines on a dark background, each corresponding to a particular electron transition in the atom (quantized energy levels).
The continuous spectrum (e.g., sunlight passed through a prism) shows all wavelengths of visible light with no gaps – it forms a full rainbow.
Example
Ultraviolet light has a wavelength of 120 nm. Calculate its frequency and photon energy.
▶️Answer/Explanation
Given: \( \lambda = 120 \, \text{nm} = 1.20 \times 10^{-7} \, \text{m} \)
Use \( c = f\lambda \) → \( f = \frac{c}{\lambda} = \frac{3.00 \times 10^8}{1.20 \times 10^{-7}} = 2.50 \times 10^{15} \, \text{Hz} \)
Now use \( E = hf = (6.63 \times 10^{-34})(2.50 \times 10^{15}) = 1.66 \times 10^{-18} \, \text{J} \)