Structure 3.2.10 – Proton Nuclear Magnetic Resonance (¹H NMR) Spectroscopy
What is ¹H NMR Spectroscopy?
- Proton nuclear magnetic resonance (¹H NMR) spectroscopy is an analytical technique used to determine the molecular structure of organic compounds by studying the behavior of hydrogen nuclei (protons) in a magnetic field.
- Many atoms, including hydrogen, possess a property called nuclear spin. When placed in a strong external magnetic field, these hydrogen nuclei (¹H) can align either with or against the field. These orientations represent different energy levels.
- ¹H NMR works by applying a specific radiofrequency (RF) radiation that causes these hydrogen nuclei to transition from a lower to a higher energy state. When the radiation is turned off, the nuclei return to their original state and release energy, which is detected and translated into a spectrum.
![]()
Key Concepts:
- Nuclear Spin: Hydrogen-1 nuclei behave like tiny magnets due to their spin, making them detectable by NMR.
- Magnetic Field: In the presence of a strong external magnetic field, these spins align either parallel (low energy) or anti-parallel (high energy).
- Resonance: When exposed to radiofrequency radiation, nuclei absorb energy and flip to a higher energy spin state—this is called resonance.
- Chemical Shift: The position of an NMR signal depends on the chemical environment of the proton—this is measured as a shift from a reference standard (TMS) in parts per million (ppm).
Interpreting ¹H NMR Spectra to Deduce Structure
¹H NMR spectra provide rich structural information about organic compounds. Interpretation involves analyzing the number of signals, their chemical shifts (δ), and the relative area under each peak (from integration).
1. Number of Signals
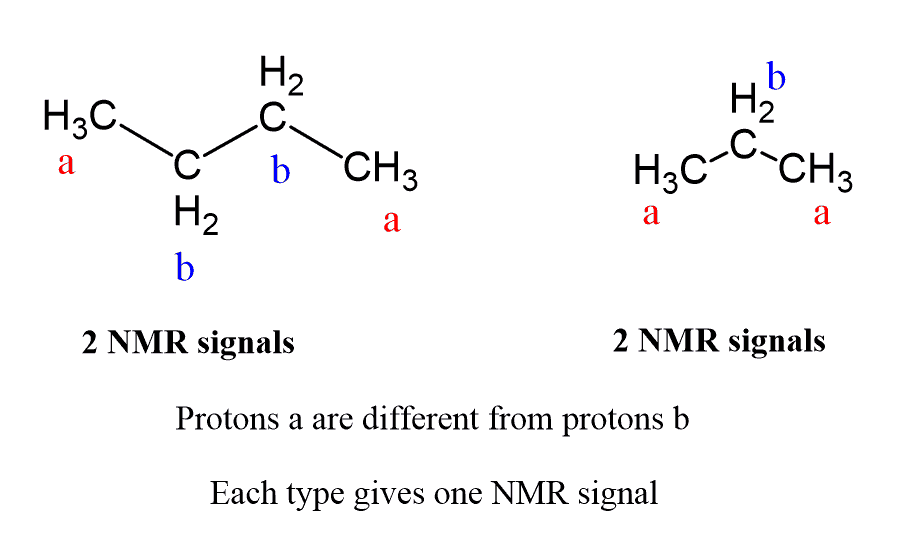
Each signal in a ¹H NMR spectrum represents a set of equivalent hydrogen atoms (a unique proton environment). Equivalent protons experience the same magnetic environment and appear as one signal.
- 1 signal → all protons are in the same environment (e.g., \( CH_4 \))
- 2 signals → two different environments (e.g., \( CH_3CH_3 \))
2. Chemical Shift (δ, in ppm)
The position of each signal along the x-axis indicates the chemical environment of the hydrogen. It is affected by nearby electronegative atoms, π-bonds, and hybridization. More deshielded (electron-poor) protons appear downfield (higher ppm).
Proton Type | Environment | Typical δ (ppm) |
|---|---|---|
| Alkyl (\( CH_3, CH_2 \)) | Saturated chain | 0.9 – 1.5 |
| Next to O or Cl | \( CH_2Cl \), \( CH_3OH \) | 3.0 – 4.5 |
| Alkene | \( CH=CH \) | 4.5 – 6.5 |
| Aromatic | Benzene ring | 6.5 – 8.0 |
| Aldehyde | \( –CHO \) | 9.0 – 10.0 |
| Carboxylic Acid | \( –COOH \) | 10.0 – 13.0 |
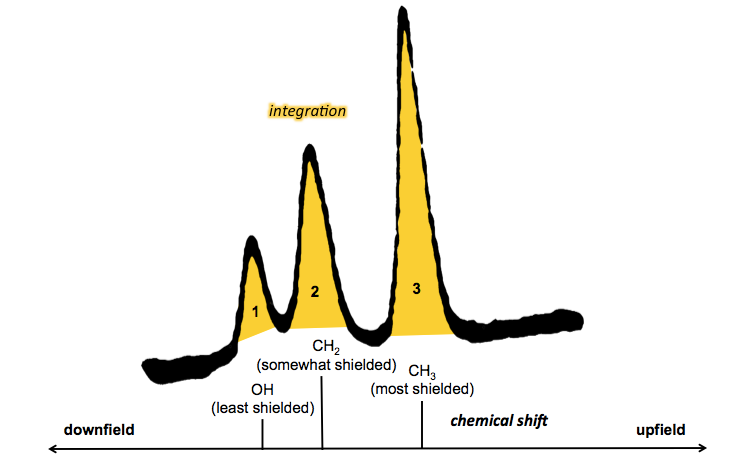
3. Relative Area Under Each Signal (Integration)
The integration trace measures the area under each peak. This corresponds to the relative number of hydrogen atoms represented by each signal.
- Integration gives a ratio, not the actual number of protons.
- If one peak integrates to 3 and another to 2, the actual protons might be 3 and 2 or 6 and 4 — the molecular formula is needed to scale them.

To deduce the structure:
- Count the number of signals → number of unique hydrogen environments.
- Use chemical shift values to identify types of hydrogen.
- Look at the integration to determine the ratio of hydrogens.
- Propose a structure consistent with all data and the molecular formula.
Example
Identify a compound with formula \( C_3H_8O \) which shows the following ¹H NMR data:
- Signal at 1.2 ppm, integration 3
- Signal at 3.6 ppm, integration 2
- Signal at 1.8 ppm, integration 1
▶️Answer/Explanation
- 1.2 ppm (3H): A \( CH_3 \) group, likely next to a \( CH_2 \).
- 3.6 ppm (2H): A \( CH_2 \) attached to oxygen (deshielded, near OH).
- 1.8 ppm (1H): A hydroxyl proton \( (OH) \).
The molecule is likely propan-1-ol \( (CH_3CH_2CH_2OH) \), which has three distinct proton environments with the given chemical shifts and integration.