Structure 3.2.12 – Combining Spectroscopic Techniques in Structural Analysis
Spectroscopy is the study of how matter interacts with electromagnetic radiation. It involves measuring how atoms and molecules absorb, emit, or scatter light (or other forms of electromagnetic energy) to gain information about their structure, composition, and physical properties.
In organic chemistry, it is common to use multiple spectroscopic techniques in combination to determine the complete structure of a compound. Each method reveals specific details about the molecule, and when interpreted together, they provide a comprehensive understanding of its molecular structure.
Why Combine Techniques?
Each spectroscopic method offers different insights. No single technique can reveal the entire structure alone, so chemists use multiple tools together to:
- Confirm molecular mass and molecular formula
- Identify functional groups (e.g., alcohols, ketones, carboxylic acids)
- Understand the carbon-hydrogen framework of the molecule
Common Techniques Used Together
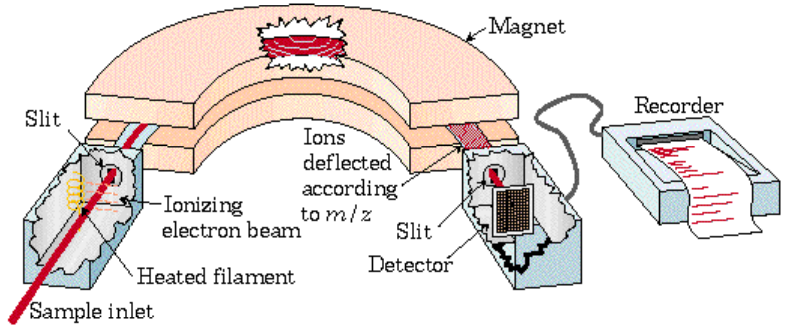
- Mass Spectrometry (MS): Identifies the molecular ion peak to determine the molecular mass, and shows fragmentation patterns that help deduce parts of the molecular structure.
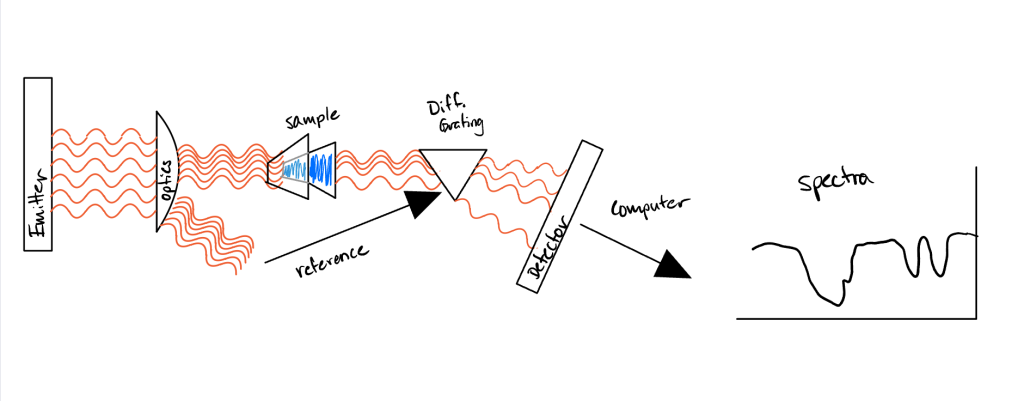
- Infrared Spectroscopy (IR): Detects the presence of functional groups based on characteristic absorption of bond vibrations in the functional group region (usually above 1500 cm–1).
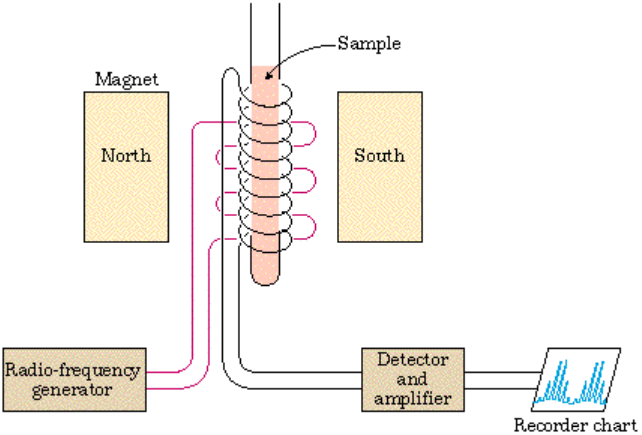
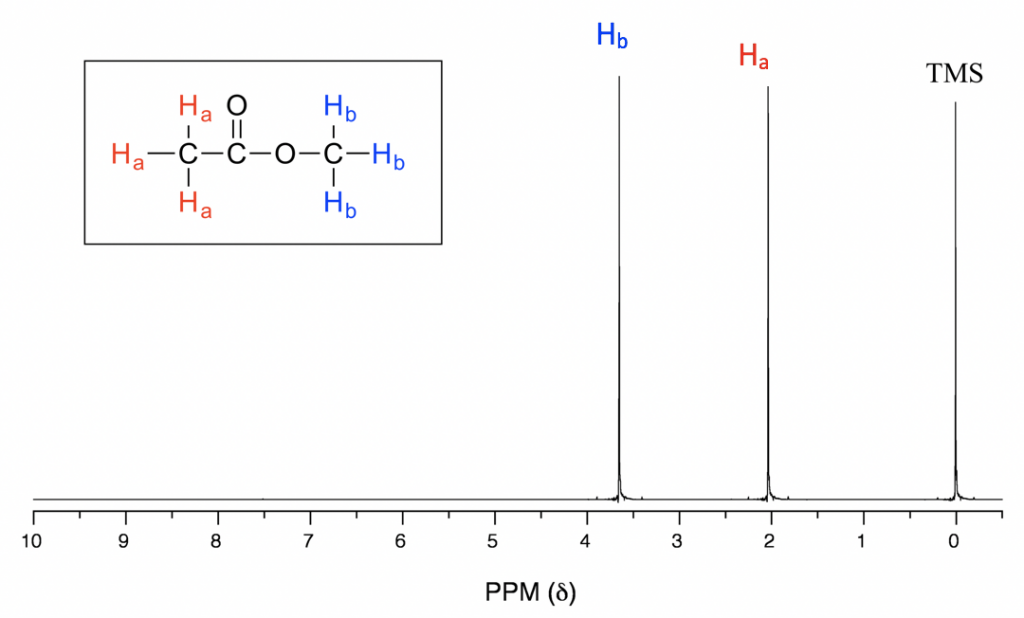
- ¹H Nuclear Magnetic Resonance (¹H NMR): Reveals the number of unique hydrogen environments, their chemical shifts (δ), splitting patterns (coupling with neighboring protons), and integration (relative number of protons in each environment).
Interpreting Spectroscopic Data to Deduce Molecular Structure
Once data from mass spectrometry (MS), infrared spectroscopy (IR), and ¹H NMR have been collected, the next step is to systematically interpret all the information together to deduce the structure of the compound. Each technique provides different clues, and combining them allows us to reconstruct the molecule step by step.
Interpretation Strategy
1. Start with Mass Spectrometry (MS):
- Identify the molecular ion peak (M⁺) to find the molecular mass.
- Use isotopic patterns to detect the presence of elements like Cl or Br.
- Analyze fragmentation peaks to identify potential substructures.
2. Move to Infrared Spectroscopy (IR):
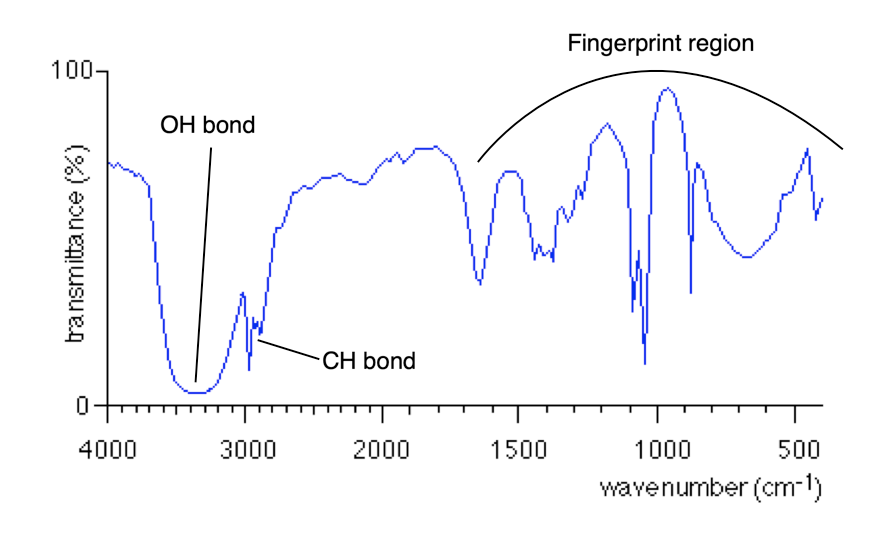
- Focus on the functional group region above 1500 cm–1.
- Check for characteristic absorptions such as:
- Broad peak at ~3200–3600 cm–1 → \( O-H \) (alcohol or carboxylic acid)
- Sharp peak near ~1700 cm–1 → \( C=O \) (carbonyl group)
- Stretch at ~2850–3100 cm–1 → \( C-H \) (alkyl/alkene)
3. Then Analyze ¹H NMR:
- Count the number of distinct signals → number of unique proton environments.
- Use chemical shift (δ) values to determine types of protons (e.g., alkyl, vinylic, alcohol).
- Use integration to find the relative number of protons in each environment.
- Use splitting patterns (singlet, doublet, triplet, etc.) to identify neighboring protons and deduce connectivity.
When combined, MS, IR, and ¹H NMR provide a full picture of the molecule’s identity and structure.
Important Tips
- Always check that the proposed structure matches the molecular formula from MS.
- IR helps confirm the presence or absence of key functional groups.
- ¹H NMR reveals the carbon-hydrogen framework and symmetry of the molecule.
- Use all evidence together. One technique alone is rarely conclusive.
Example
Identify the compound given the molecular formula \( C_3H_6O \) and the following spectroscopic data:
▶️Answer/Explanation
1. Mass Spectrum (MS)
- Molecular ion peak (M⁺) at m/z 58 → indicates a molecular mass of 58.
- Base peak at m/z 29 → suggests ethyl or formyl fragment.
2. Infrared Spectrum (IR)
- Sharp, strong absorption at ~1720 cm⁻¹ → confirms presence of a carbonyl group (C=O).
- Moderate C–H stretch around 2720 cm⁻¹ → typical for an aldehyde proton.
3. ¹H NMR Spectrum
- Triplet at ~1.0 ppm (3H) → methyl group \( CH_3 \) next to \( CH_2 \).
- Quartet at ~2.4 ppm (2H) → methylene \( CH_2 \) next to \( CH_3 \) and carbonyl.
- Singlet at ~9.8 ppm (1H) → aldehyde proton \( CHO \).
The data fits the structure of an aldehyde with three carbon atoms: propanal: \( CH_3CH_2CHO \)
Example
Find the compound with the molecular formula \( C_3H_6O \) and the following spectroscopic data:
▶️Answer/Explanation
1. Mass Spectrum (MS)
- Molecular ion peak (M⁺) at m/z 58 → confirms molecular mass is 58.
- Major fragment at m/z 43 → corresponds to \( CH_3CO^+ \), typical for a ketone.
2. Infrared Spectrum (IR)
- Sharp, strong band at 1715 cm⁻¹ → indicates a carbonyl group (C=O).
- No broad O–H stretch → rules out alcohols and acids.
3. ¹H NMR Spectrum
- Singlet at ~2.1 ppm (integration = 6H) → two equivalent methyl groups.
- No splitting → methyl groups not adjacent to any protons.
All spectroscopic data are consistent with propanone (acetone), whose structure is: \( CH_3COCH_3 \)