Structure 3.2.8 – Mass Spectrometry (MS) of Organic Compounds
Mass spectrometry (MS) is an analytical technique used to determine the molecular mass and structure of organic compounds by measuring the mass-to-charge ratio (m/z) of their ionized fragments.
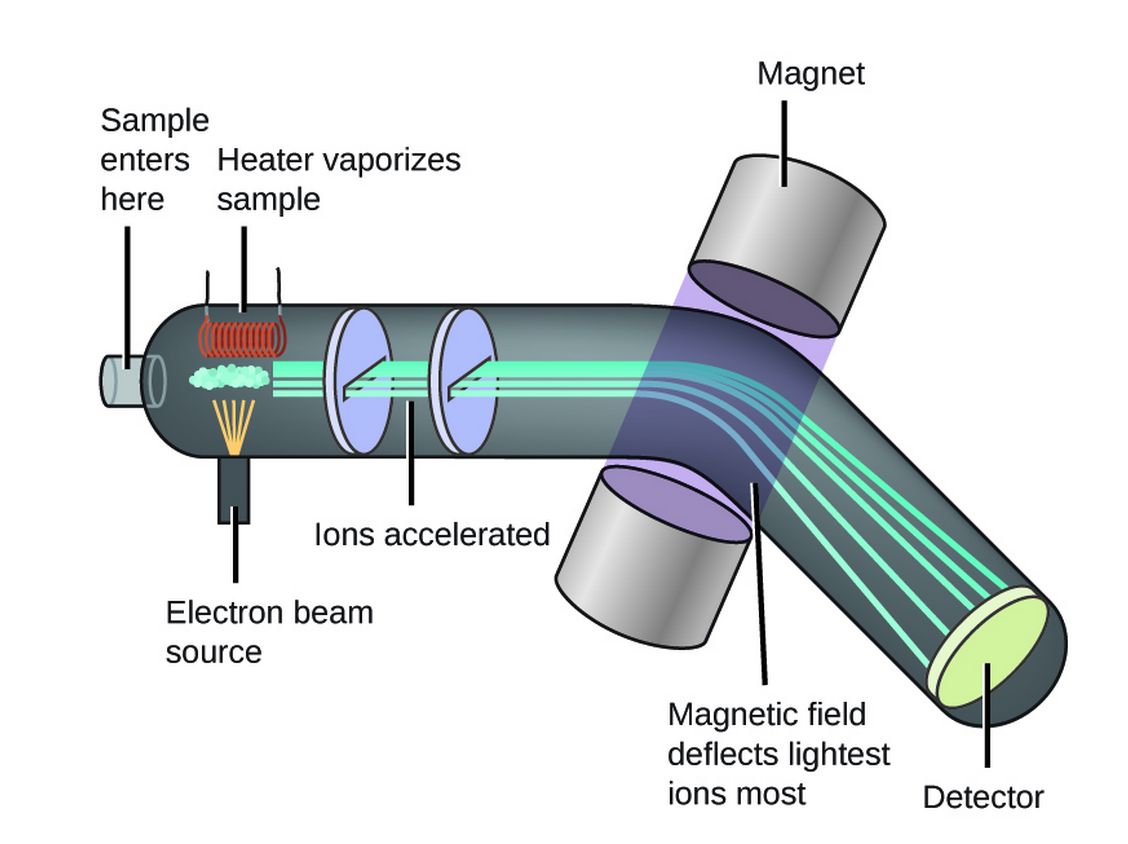
How Mass Spectrometry Works
- The organic sample is vaporized and bombarded with high-energy electrons, causing ionization.
- This ionization removes one electron to form a molecular ion \( M^+ \), which is often unstable.
- The molecular ion may undergo fragmentation, breaking into smaller ions and radicals.
- These fragments are separated by mass and detected, producing a mass spectrum.
Key Features of a Mass Spectrum
- Molecular ion peak (M⁺): The peak with the highest m/z value (excluding isotopic peaks). It represents the relative molecular mass (Mr) of the compound.
- Base peak: The tallest peak in the spectrum. It corresponds to the most stable or most abundant fragment.
- Fragmentation pattern: Each compound has a unique set of fragments, useful for structural identification.

Fragmentation of Organic Compounds
Fragmentation occurs when the molecular ion breaks into smaller ions. These fragment ions help deduce the structure of the original molecule. The fragmentation depends on the stability of resulting ions and the nature of functional groups present.
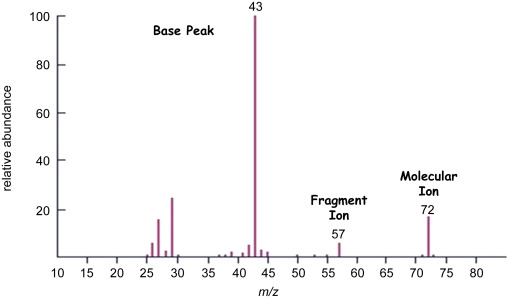
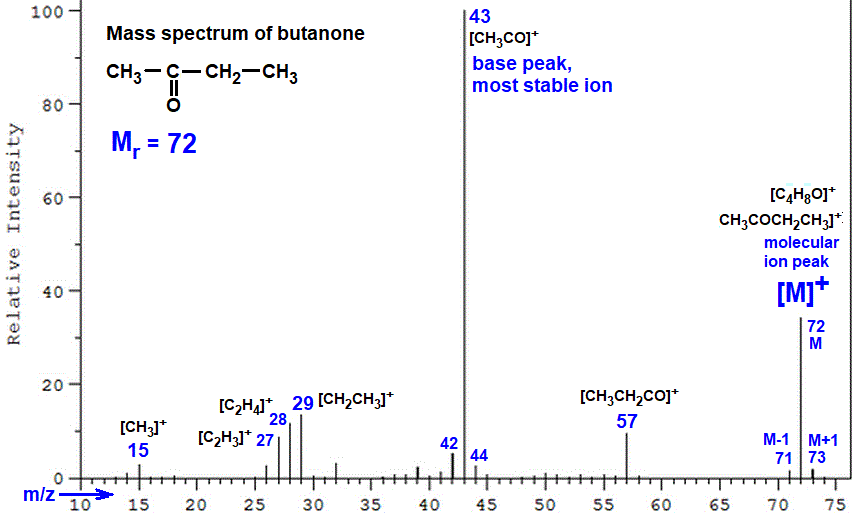
Example:
Give fragmentation of butan-2-one
- Molecular ion: \( CH_3COCH_2CH_3^+ \), m/z = 72
- Fragment: \( CH_3CO^+ \), m/z = 43 → common for ketones
- Fragment: \( CH_3CH_2^+ \), m/z = 29
Example
The mass spectrum of ethanol shows a molecular ion peak at m/z = 46. Give its fragmentation.
▶️Answer/Explanation
- Molecular ion: \( CH_3CH_2OH^+ \), m/z = 46
- Fragment: \( CH_2OH^+ \), m/z = 31 → due to loss of a methyl group
- Fragment: \( CH_3^+ \), m/z = 15
Deduction of Structural Features from MS Fragmentation Patterns
Mass spectrometry (MS) not only reveals the molecular mass of a compound via the molecular ion peak but also provides insight into its structure through fragmentation patterns. By analyzing these fragment ions, we can deduce the presence of certain functional groups and carbon skeleton features.
How to Deduce Structural Features
- Identify the molecular ion (M⁺) peak: This gives the molecular mass of the compound.
- Observe common fragment peaks: Compare their m/z values to known fragment masses.
- Match fragments to structural units: Characteristic ions suggest specific groups (e.g., methyl = 15, ethyl = 29, carbonyl = 43).
- Analyze loss patterns: A peak 18 units below M⁺ indicates a loss of H2O (e.g., alcohols), a loss of 15 may indicate a methyl group, etc.
Common Fragmentation Indicators
| m/z | Fragment | Indicates |
|---|---|---|
| 15 | \( CH_3^+ \) | Methyl group |
| 17 | \( OH^+ \) | Hydroxyl group |
| 29 | \( CH_3CH_2^+ \) | Ethyl group |
| 31 | \( CH_2OH^+ \) | Primary alcohol |
| 43 | \( CH_3CO^+ \) | Ketone or acylium ion |
| 44 | \( CO_2^+ \) | Carboxylic acid or ester |
| 77 | \( C_6H_5^+ \) | Phenyl group |
Tips for Deduction
- Look for strong peaks that suggest stable ions.
- Subtract m/z values between peaks to identify neutral losses.
- Compare the spectrum with known patterns of functional groups.
Example
A compound has a molecular ion peak at m/z = 60 and fragment peaks at m/z = 43 and m/z = 15.
▶️Answer/Explanation
- Molecular ion peak (M⁺) at 60 → Suggests molecular mass is 60
- Fragment at 43 → likely \( CH_3CO^+ \), a common fragment from ketones
- Fragment at 15 → likely \( CH_3^+ \), indicating presence of a methyl group
These fragments suggest the compound is a ketone. One possible structure is propanone (\( CH_3COCH_3 \)).
Fragmentation Patterns by Functional Group
1. Alkanes
Alkanes undergo simple cleavage of C–C bonds.
- Molecular ion peak is usually weak.
- Fragments occur in steps of 14 (CH2 groups): e.g., m/z = 43, 29, 15
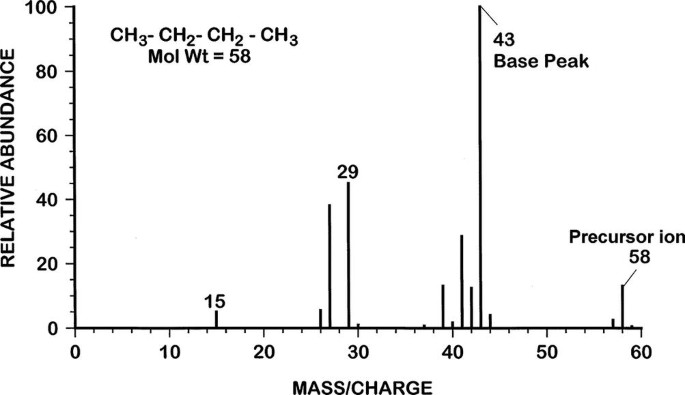
Example:
Give fragmentation of Butane (\( CH_3CH_2CH_2CH_3 \))
- Molecular ion: m/z = 58
- Common fragments: m/z = 43 (propyl), 29 (ethyl), 15 (methyl)
-
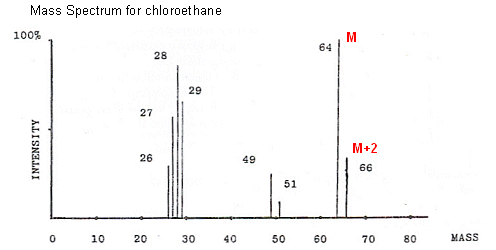
2. Halogenoalkanes
Characteristic peaks arise from the halogen atoms, often showing isotopic patterns.
- Chlorine gives M⁺ and M+2 peaks (ratio ~3:1)
- Bromine gives M⁺ and M+2 peaks (ratio ~1:1)
- Common loss: halogen (e.g., loss of Cl, Br)
Example:
Give fragmentation of Chloroethane (\( CH_3CH_2Cl \))
- Molecular ion: m/z = 64 and 66 (due to Cl isotopes)
- Fragment: \( CH_3CH_2^+ \), m/z = 29
3. Alcohols
Alcohols undergo alpha-cleavage (C–C bond next to the OH group).
- Often show a fragment at m/z = 31 (from \( CH_2OH^+ \))
- Loss of water (M – 18) is common
Example:
Give fragmentation of Ethanol (\( CH_3CH_2OH \))
- Molecular ion: m/z = 46
- Fragment: m/z = 31 (from \( CH_2OH^+ \))
- Fragment: m/z = 29 (from ethyl)
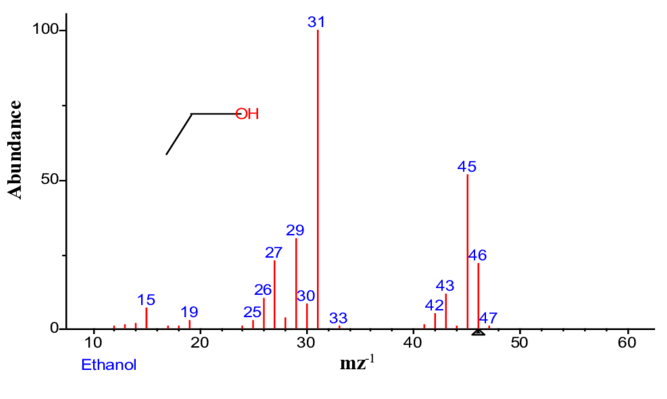
Example
A compound has the molecular formula \( C_2H_6O \). The MS spectrum shows peaks at m/z = 46, 31, and 29.
▶️Answer/Explanation
- m/z = 46 → Molecular ion (M⁺) → Mr = 46 → matches ethanol
- m/z = 31 → \( CH_2OH^+ \) fragment from alpha-cleavage → confirms OH group
- m/z = 29 → \( CH_3CH_2^+ \) → ethyl fragment
Conclusion: The compound is ethanol (\( CH_3CH_2OH \)).