Reactivity 3.1.14 — Acid–base indicators and their equilibrium expressions
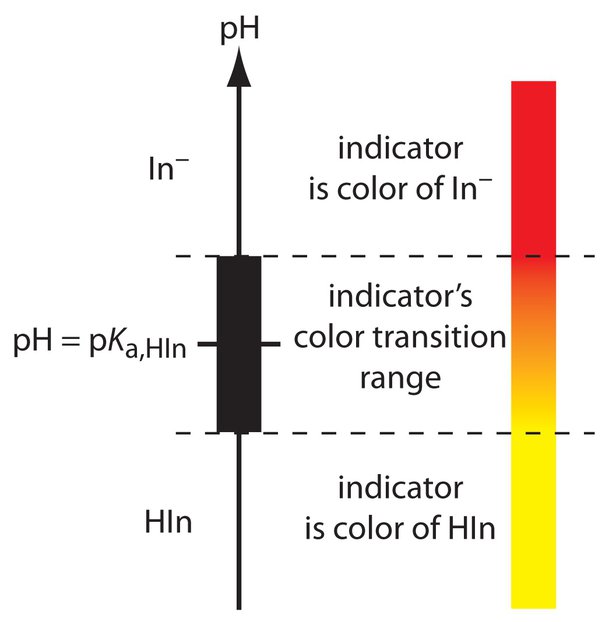
Acid–base indicators are typically weak acids (or weak bases) whose conjugate acid–base pairs exhibit different colours. The colour observed in a solution depends on the pH, which affects the relative concentrations of the acid (HIn) and its conjugate base (In⁻).
Key Interpretation Point
The colour change of an indicator occurs at a pH value approximately equal to its pKa. This point is called the end point and reflects when the ratio \([ \text{In}^- ] / [ \text{HIn} ] \approx 1\), i.e., both acid and conjugate base are present in nearly equal amounts.
Equilibrium Expression for a Weak Acid Indicator
Consider a weak acid indicator represented by HIn, where HIn (acid form) has one colour and In⁻ (conjugate base) has a different colour:
\(\text{HIn (aq)} \rightleftharpoons \text{H}^+ (aq) + \text{In}^- (aq)\)
At equilibrium, the acid dissociation constant \( K_a \) is:
\(K_a = \frac{[\text{H}^+][\text{In}^-]}{[\text{HIn}]}\)
Taking the negative logarithm of both sides:
\(\text{pH} = \text{pKa} + \log\left(\frac{[\text{In}^-]}{[\text{HIn}]}\right)\)
This is the Henderson–Hasselbalch equation. It shows how the ratio of the conjugate base to the acid form controls the pH and therefore the observed colour of the solution.
Colour Change Mechanism
| pH condition | Ratio \([\text{In}^-]/[\text{HIn}]\) | Predominant species | Observed colour |
|---|---|---|---|
| \(\text{pH} \ll \text{pKa}\) | \(\ll 1\) | HIn (acid) | Colour of HIn |
| \(\text{pH} = \text{pKa}\) | \(= 1\) | HIn and In⁻ in equal concentrations | Intermediate colour (mix of both) |
| \(\text{pH} \gg \text{pKa}\) | \(\gg 1\) | In⁻ (base) | Colour of In⁻ |
Example
Phenolphthalein is a weak acid indicator with a pKa of approximately 9.3. The acid form (HIn) is colourless, and the base form (In⁻) is pink.
In an acidic solution where pH < 8, the solution remains colourless. As the pH approaches and exceeds 9.3, more In⁻ forms and the solution turns pink.
▶️Answer/Explanation
The equilibrium shifts depending on the concentration of \(\text{H}^+\). In acidic conditions (low pH), the concentration of \(\text{H}^+\) is high, which pushes the equilibrium left, favouring HIn (colourless). In basic conditions (high pH), \(\text{H}^+\) is removed, shifting the equilibrium to the right and increasing the concentration of In⁻ (pink).
The sharpest colour change occurs around pH 9.3, which is the pKa of phenolphthalein.
Nature and Role of Acid–Base Indicators
Acid–base indicators are typically weak acids, represented by the general formula \( \text{HInd} \). These substances establish an equilibrium in aqueous solution as follows:
\( \text{HInd (aq)} \rightleftharpoons \text{H}^+ (aq) + \text{Ind}^- (aq) \)
The acid form \( \text{HInd} \) and its conjugate base \( \text{Ind}^- \) are typically different in colour. As the pH of the solution changes, the position of this equilibrium shifts, causing a visible colour change. This colour change occurs over a narrow pH range and is centered around the pKa of the indicator.
At:
- \( \text{pH} < \text{p}K_a \): The equilibrium lies to the left → more \( \text{HInd} \) → colour of the acid form.
- \( \text{pH} > \text{p}K_a \): The equilibrium lies to the right → more \( \text{Ind}^- \) → colour of the base form.
- \( \text{pH} = \text{p}K_a \): Equal amounts of both forms → intermediate colour (usually a blend or midpoint).
Explanation Using Equilibrium Concepts
Let us write the equilibrium law for the dissociation of the indicator:
\( K_a = \dfrac{[\text{H}^+][\text{Ind}^-]}{[\text{HInd}]} \)
Rewriting in terms of logarithms:
\( \text{pH} = \text{p}K_a + \log \left( \dfrac{[\text{Ind}^-]}{[\text{HInd}]} \right) \)
This is the Henderson–Hasselbalch equation, which shows that the ratio of the conjugate base to the acid form determines the pH – and consequently, the colour seen. The observable colour change usually spans about two pH units: from \( \text{p}K_a – 1 \) to \( \text{p}K_a + 1 \).
Examples of Common Indicators
| Indicator | pH Range | Colour (Low pH) | Colour (High pH) |
|---|---|---|---|
| Methyl orange | 3.1 – 4.4 | Red | Yellow |
| Bromothymol blue | 6.0 – 7.6 | Yellow | Blue |
| Phenolphthalein | 8.3 – 10.0 | Colourless | Pink |
Universal Indicator
Unlike individual indicators, universal indicator is a complex mixture of several acid–base indicators. This allows it to provide a continuous range of colour changes over a wide pH span, typically from pH 1 to 14. It does not function as a single equilibrium system but combines the colour transitions of multiple indicators to create a gradient of hues that corresponds to specific pH values.
This makes the universal indicator useful for estimating the pH of a solution across a broad range, although it is not precise enough to determine equivalence points in titration due to its gradual and composite colour transitions.
Key Point:
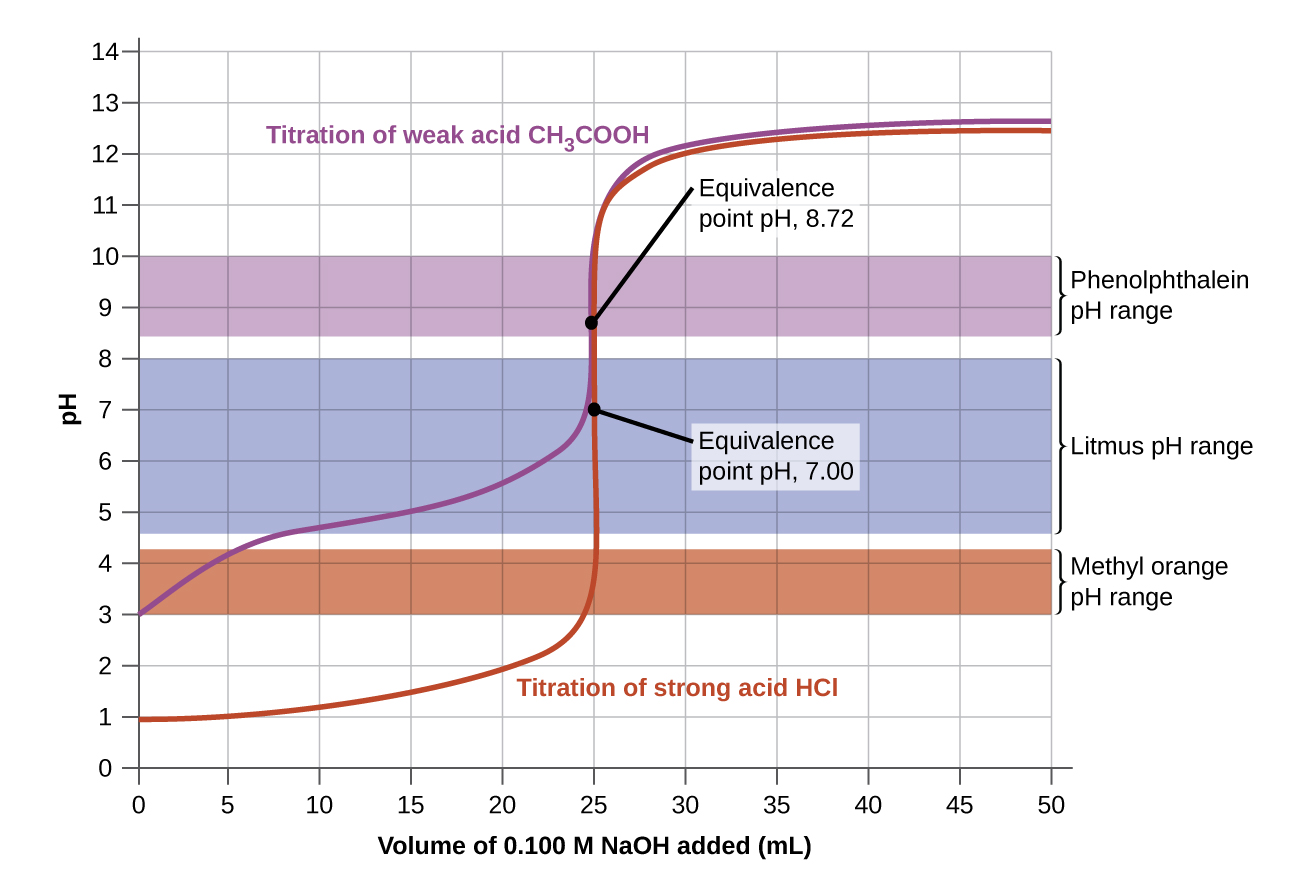
An ideal indicator for titration changes colour sharply at a pH that matches the equivalence point of the titration curve.
Example
In a titration of a weak acid (pKa = 4.7) with a strong base, which indicator is most appropriate?
▶️Answer/Explanation
The equivalence point will occur at a pH greater than 7 (typically around 8–9). However, the steepest part of the curve where the pH rapidly changes will depend on the acid’s strength and concentration. Phenolphthalein (pH 8.3–10.0) is appropriate because it changes colour in the pH region corresponding to the equivalence point of a weak acid–strong base titration.