Reactivity 3.1.8 — pH Curves for Neutralization Reactions
A pH curve is a graphical representation of the change in pH of a solution during an acid–base titration. It helps visualize how pH evolves as one reactant is gradually added to another and plays a key role in understanding acid–base behavior, particularly in neutralization reactions.
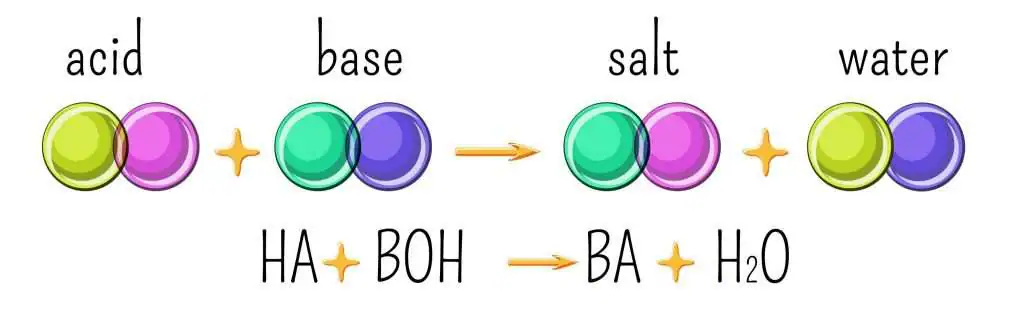
Neutralization Reactions:
These are reactions between acids and bases that result in the formation of water and a salt. For example:
\( \text{H}^+(aq) + \text{OH}^-(aq) \rightarrow \text{H}_2\text{O}(l) \)
During this process, the acidic and basic properties cancel out, moving the pH toward neutrality depending on the strength of the acid and base involved.
Shape of the Curve:
The exact shape of a pH curve depends on the strength of the acid and base involved in the neutralization. Key elements that define the shape include:
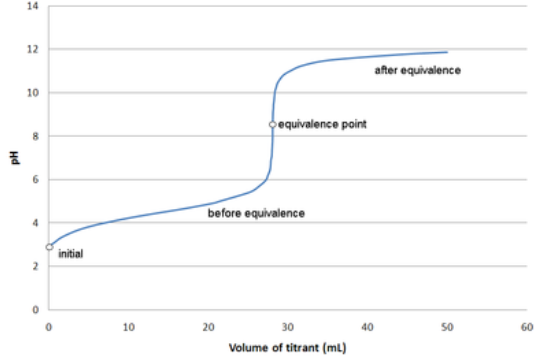
- Initial pH: Determined by the strength and concentration of the solution in the flask (acid or base).
- pH change before equivalence: As titrant is added, the pH increases slowly, especially for weak acids forming buffer systems with their conjugate base.
- Equivalence Point: The point at which stoichiometrically equal amounts of acid and base have reacted. A sharp, nearly vertical rise in pH is observed here for strong–strong titrations.
- Final pH: After the equivalence point, the added titrant is in excess, determining the final pH of the solution.
Why pH Curves Matter:
- Allow determination of equivalence point volume.
- Help in selecting a suitable indicator.
- Reveal buffer behavior and acid–base strength.
Note:
A pH curve provides not just qualitative, but quantitative insight into acid–base interactions, essential for experimental and theoretical understanding in IB chemistry.
Sketching and Interpreting the General Shape of pH Curves
A pH curve visually displays how pH changes during a titration as a strong or weak acid is gradually neutralized by a base (or vice versa). Proper interpretation of these curves allows chemists to identify key features such as the strength of acids and bases, buffer regions, and equivalence points.
Important IB Focus: Only monoprotic neutralization reactions are assessed. These involve the transfer of one proton per acid or base molecule and produce a single, clear equivalence point on the graph.
Key Features to Include When Sketching:
- Initial pH:
- Determined by the acid or base initially present in the flask.
- Strong acid: very low pH (~1).
- Weak acid: higher pH (~3–6) due to partial ionization.
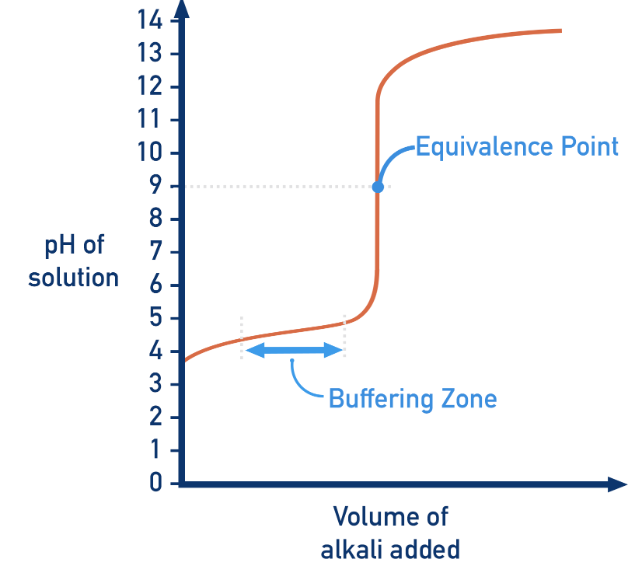
- Buffer Region (Only in Weak Acid or Base Titrations):
- Occurs before the equivalence point when both the weak acid and its conjugate base are present.
- pH changes gradually and resists sudden changes — this is the buffer zone.
- Equivalence Point:
- Volume at which stoichiometric amounts of acid and base have reacted.
- Appears as the center of the steep vertical rise in pH.
- The pH at equivalence varies:
- Strong acid + strong base: pH = 7.
- Weak acid + strong base: pH > 7 (due to formation of basic salt).
- Strong acid + weak base: pH < 7 (due to formation of acidic salt).
- Vertical (Steep) Rise:
- Occurs near the equivalence point.
- Indicates a rapid pH shift with small volume addition.
- Most pronounced in strong acid–strong base titrations.
- Used to determine the most appropriate indicator (must change color within this range).
- Final pH:
- After the equivalence point, the added titrant is in excess.
- For excess strong base, pH levels off between 12–14.
- For excess weak base, final pH remains lower (~9–11).
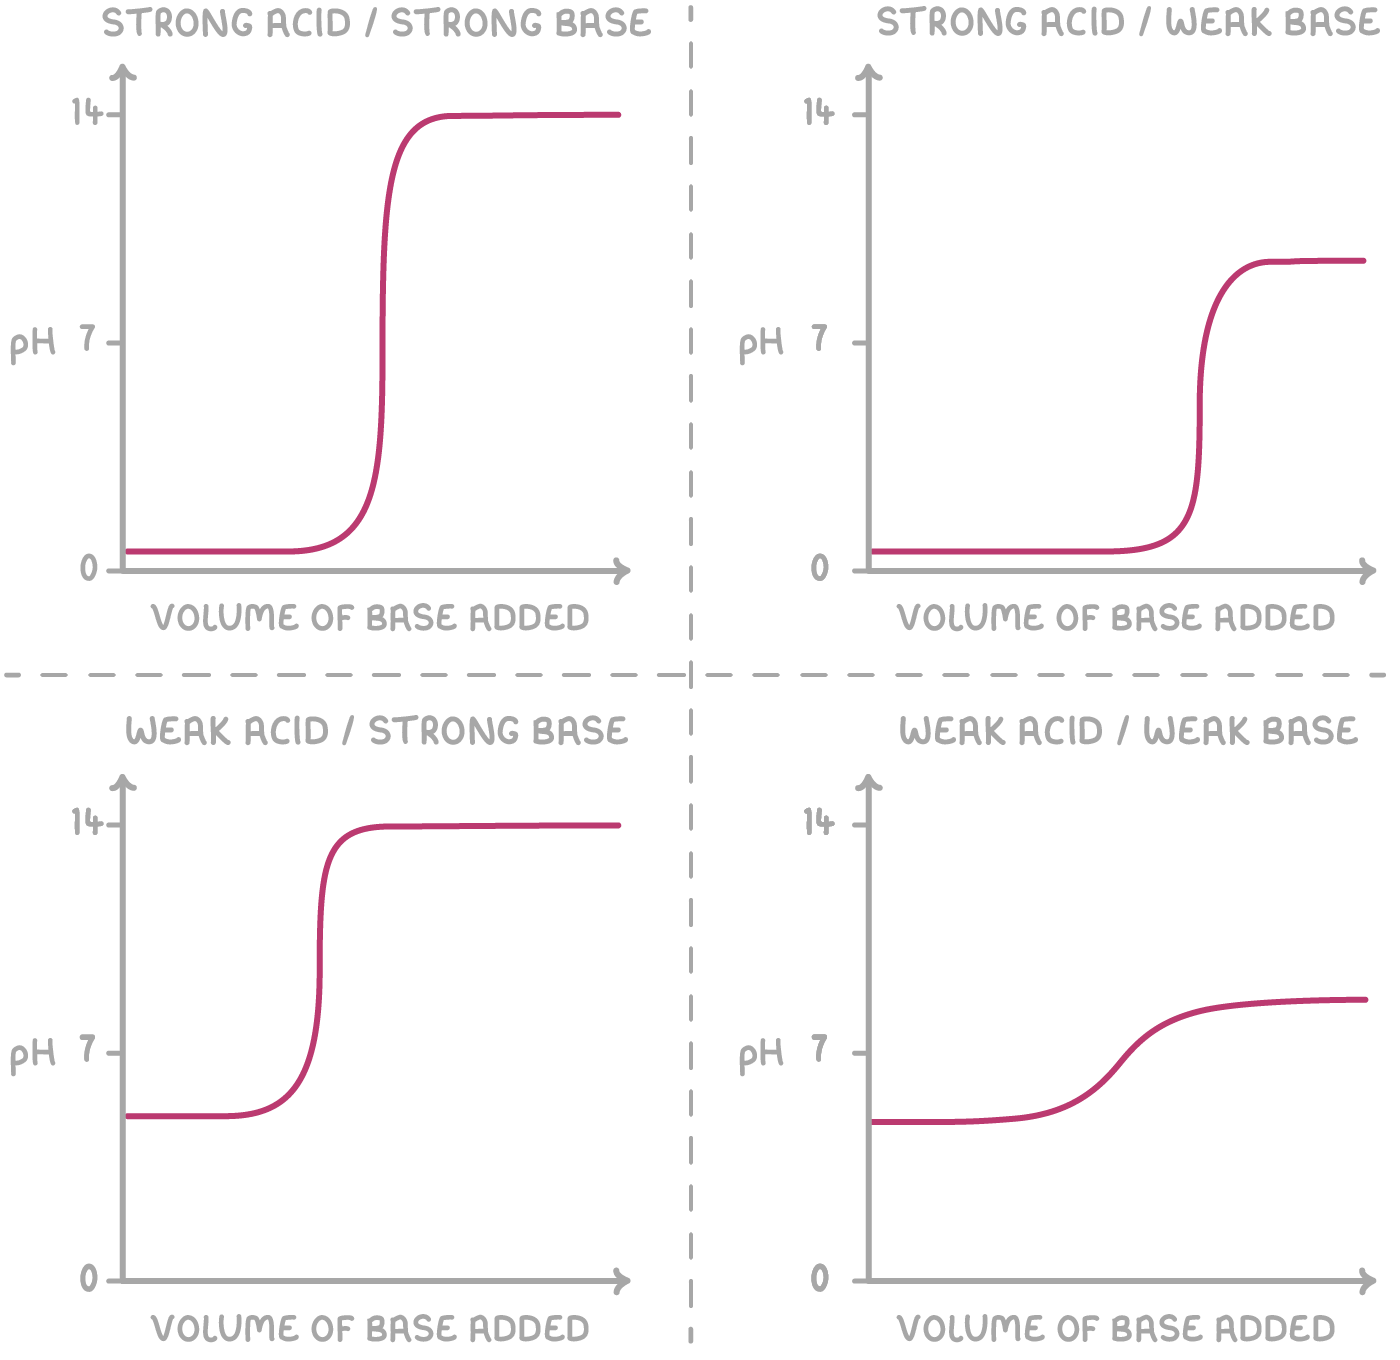
Visual Characteristics by Titration Type (Strength of Acids and Bases):
| Titration Type | Initial pH | Equivalence Point (pH) | Buffer Region? | Curve Behavior | Indicator Choice |
|---|---|---|---|---|---|
| Strong Acid + Strong Base | ~1 | pH = 7 | No | Symmetrical and steep | Phenolphthalein or Methyl Orange |
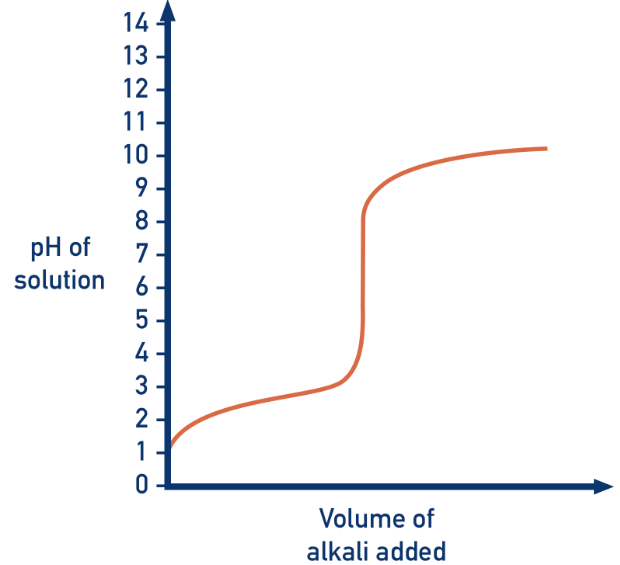
| Weak Acid + Strong Base | ~3–6 | pH > 7 | Yes | Buffer region before steep rise | Phenolphthalein |
| Strong Acid + Weak Base | ~1 | pH < 7 | No | Flatter after equivalence | Methyl Orange |
| Weak Acid + Weak Base | ~4–6 | ~6–8 (unclear) | Yes | No steep vertical rise | None (use pH meter) |
How to Interpret a pH Curve Accurately:
- Identify the acid or base strength from the shape and initial pH.
- Use the equivalence point to determine when neutralization is complete.
- Recognize buffer regions for weak acid/base titrations.
- Match the indicator color change range with the steep part of the curve.
Sketching Tips:
- Label axes: volume of titrant (x-axis) and pH (y-axis).
- Include clear changes: initial slope, buffer, equivalence jump, and final plateau.
- Mark the equivalence point clearly with an annotation.
Conclusion: pH curves reveal vital information about acid–base reactions, and their interpretation is key for identifying reaction endpoints, suitable indicators, and acid–base strength. Mastery of sketching and analyzing these graphs is essential in IBDP Chemistry, especially during titration-based questions and experimental design.
Example
25.0 mL of 0.10 M sodium hydroxide (NaOH) is titrated with 0.20 M hydrochloric acid (HCl).
- Identify whether the acid and base are strong or weak.
- State whether the acid:base reaction occurs in a 1:1 molar ratio.
- Calculate the initial pH before any HCl is added.
- Determine the volume of HCl required to reach the equivalence point.
- Identify the major species present at the equivalence point and predict the pH at this stage.
- Interpret the shape of the pH curve:
- Intercept with the pH axis (initial pH)
- Location and pH at the equivalence point
- End pH after excess acid is added
▶️Answer/Explanation
- Acid/base strength: HCl is a strong acid and NaOH is a strong base.
- Mole ratio: Both are monoprotic:
HCl(aq) + NaOH(aq) → NaCl(aq) + H₂O(l) - Initial pH (before any acid is added):
\[ [\text{OH}^-] = 0.10\ \text{mol/L} \Rightarrow \text{pOH} = -\log(0.10) = 1 \] \[ \text{pH} = 14 – 1 = 13 \] - Volume of HCl needed to reach equivalence:
\[ \text{Moles of NaOH} = 0.10\ \text{mol/L} \times 0.0250\ \text{L} = 2.50 \times 10^{-3}\ \text{mol} \] \[ V_{\text{HCl}} = \frac{2.50 \times 10^{-3}\ \text{mol}}{0.20\ \text{mol/L}} = 12.5\ \text{mL} \] - Major species at equivalence:
All OH⁻ has reacted with H⁺ → only NaCl and H₂O remain. NaCl does not hydrolyze, so:
pH = 7 - pH Curve features:
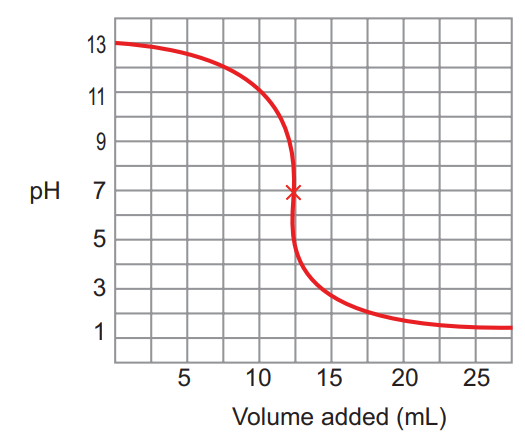
- Initial pH: 13 (basic, due to NaOH)
- Equivalence point: pH = 7 at 12.5 mL of acid added
- Final pH: Approaches 1 as HCl is added in excess
Sketch:
Example
A student titrates 20.0 mL of 0.030 mol dm−3 nitric acid (HNO₃) with 0.040 mol dm−3 potassium hydroxide (KOH).
- Determine if the acid and base are strong or weak.
- Identify whether the acid:base mole ratio is 1:1 or not.
- Calculate the initial pH of the nitric acid solution before the titration begins.
- Determine the volume of KOH required to reach the equivalence point.
- Identify the major species present at the equivalence point and whether the pH is greater than, less than, or equal to 7.
- On the pH curve:
- Label the axes
- Sketch the curve
- Mark the equivalence point with an “X”
- State the pH and volume at the equivalence point
▶️Answer/Explanation
- Strength:
Nitric acid is a strong acid, and potassium hydroxide is a strong base. Both fully dissociate in solution. - Mole ratio:
HNO₃ and KOH react in a 1:1 mole ratio:
\( \text{HNO}_3 + \text{KOH} \rightarrow \text{KNO}_3 + \text{H}_2\text{O} \) - Initial pH:
\([H^+] = 0.030 \, \text{mol dm}^{-3}\)
pH = –log₁₀(0.030) ≈ 1.52 - Volume of KOH to reach equivalence point:
Moles of acid = 0.030 × 0.020 = 6.00 × 10⁻⁴ mol
Moles of base required = same (1:1 ratio)
Volume = \( \frac{0.00060}{0.040} = 0.015 \, \text{L} = \mathbf{15.0 \, mL} \) - Major species at equivalence point:
All HNO₃ is neutralized; only KNO₃ (a neutral salt) and water remain.
Therefore, the solution is neutral → pH = 7.00 - Graph analysis:
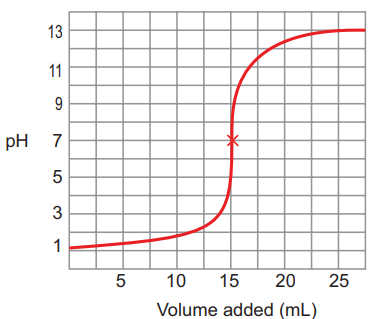
- x-axis: Volume of base added (mL)
- y-axis: pH
- The curve starts at pH ≈ 1.5, rises slowly, then sharply increases around 15 mL, and levels off at pH ≈ 13.
- At equivalence: pH = 7, Volume = 15.0 mL → mark this with “X” on the graph.