Reactivity 1.1.3 – Energy Profiles
Every chemical reaction involves a transformation of substances that is accompanied by energy changes. Whether a reaction absorbs or releases energy depends primarily on the relative stability of the reactants and products.
Key Principle
The net energy change of a chemical reaction is governed by the difference in energy between the bonds broken (in the reactants) and the bonds formed (in the products). This is directly related to the enthalpy change of the system (\( \Delta H \)).
Stability and Enthalpy
- Stable molecules are lower in energy because they have stronger, more stable bonds.
- If the products are more stable than the reactants, the reaction tends to release energy: this is an exothermic process.
- If the reactants are more stable, energy must be supplied to break bonds: this is an endothermic process.
- \( \Delta H = H_{\text{products}} – H_{\text{reactants}} \)
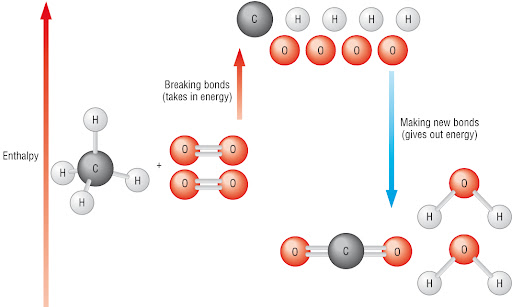
Bond Energies and Energy Transfer
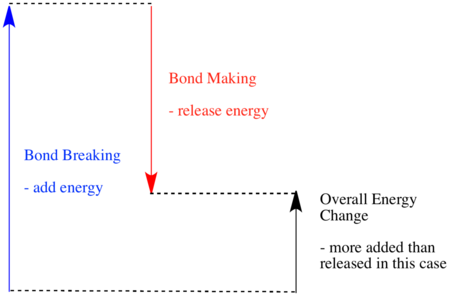
Breaking chemical bonds requires energy (endothermic), while forming new bonds releases energy (exothermic). The balance between these two determines the overall energy profile of the reaction:
- Total bond energy of reactants: energy input needed to break existing bonds.
- Total bond energy of products: energy released when new bonds form.
- Net Energy Change: \( \Delta H = \text{Energy required to break bonds} – \text{Energy released by bond formation} \)
Energy Profile Diagrams
Energy profile diagrams are graphical representations of the energy changes that occur during a chemical reaction. These diagrams help visualize whether a reaction is exothermic or endothermic and illustrate important features such as the activation energy(energy barrier) and the enthalpy change.
Axes of the Diagram
- X-axis (Reaction coordinate): Represents the progress of the reaction from reactants to products.
- Y-axis (Potential energy): Represents the energy of the system in kilojoules per mole (kJ/mol).
Features of an Energy Profile
- Reactants: Starting energy level on the left of the diagram.
- Products: Final energy level on the right of the diagram.
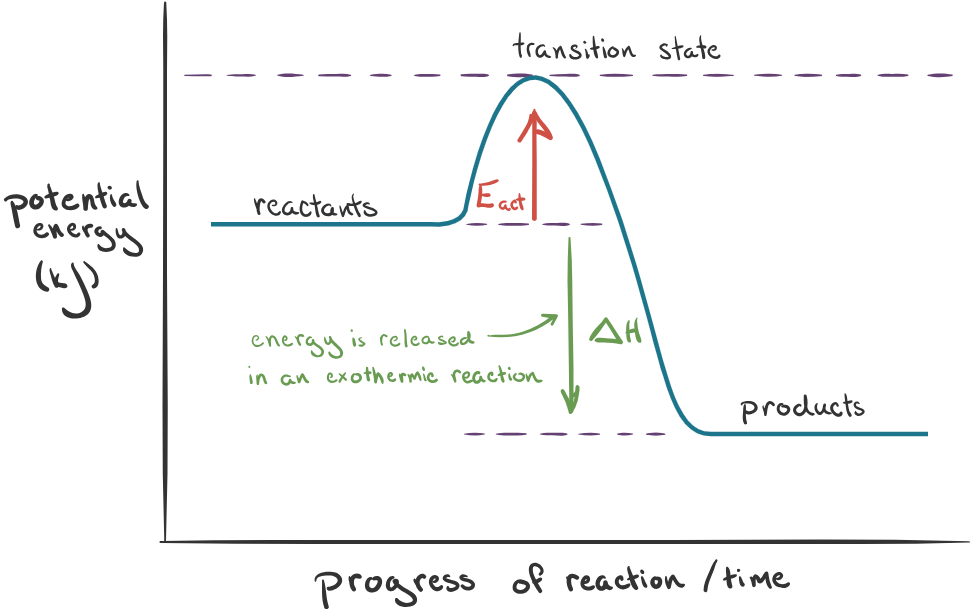
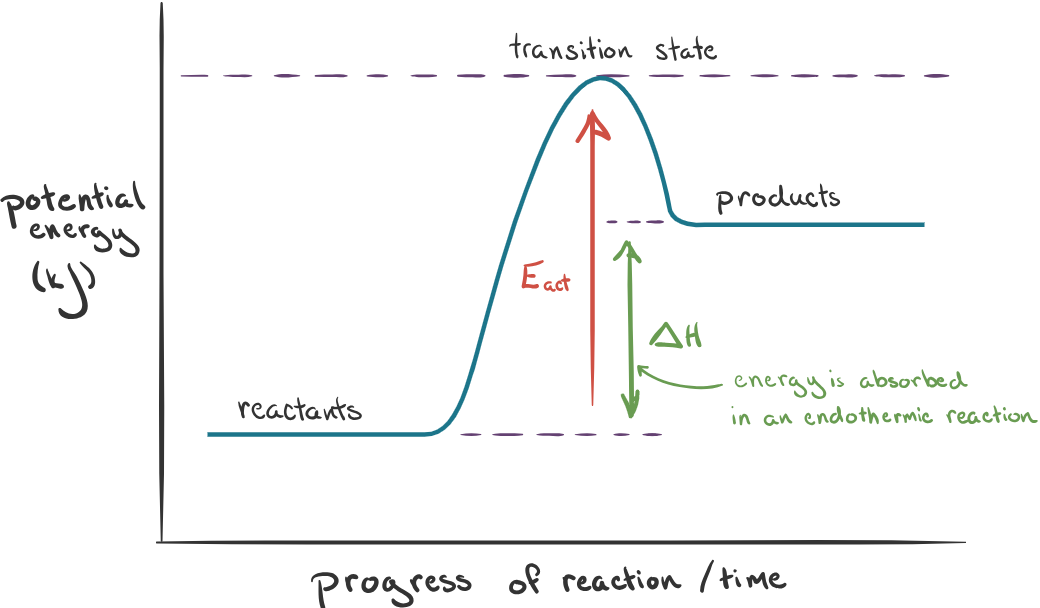
- Activation Energy (Eₐ): The minimum energy required to start the reaction; shown as the peak between reactants and products.
- Transition State: The highest point on the curve where old bonds are breaking and new ones are forming.
- Enthalpy Change (ΔH): The difference in energy between the products and reactants.
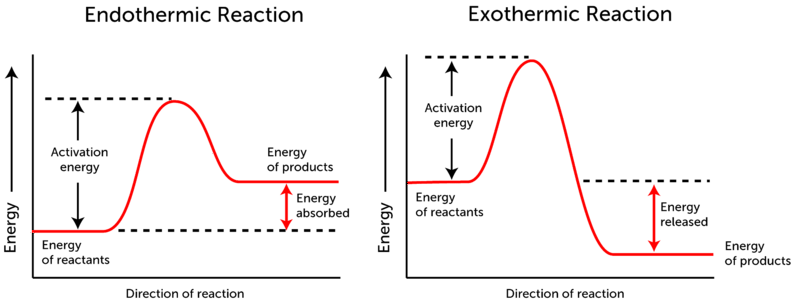
Exothermic Reaction Profile
- Energy is released to the surroundings.
- Products are more stable and have lower energy than reactants
- \( \Delta H \lt 0 \) (negative enthalpy change)
- The temperature of the surroundings increases.
Endothermic Reaction Profile
- Energy is absorbed from the surroundings.
- Products are less stable and have higher energy than reactants.
- \( \Delta H \gt 0 \) (positive enthalpy change)
- The temperature of the surroundings decreases.
Comparative Summary Table
| Feature | Exothermic Reaction | Endothermic Reaction |
|---|---|---|
| Heat Flow | Released to surroundings | Absorbed from surroundings |
| ΔH (Enthalpy change) | Negative (ΔH < 0) | Positive (ΔH > 0) |
| Relative Energy | Products have lower energy than reactants | Products have higher energy than reactants |
| Effect on Surroundings | Temperature increases | Temperature decreases |
| Common Examples | Combustion, neutralization | Photosynthesis, thermal decomposition |
Example
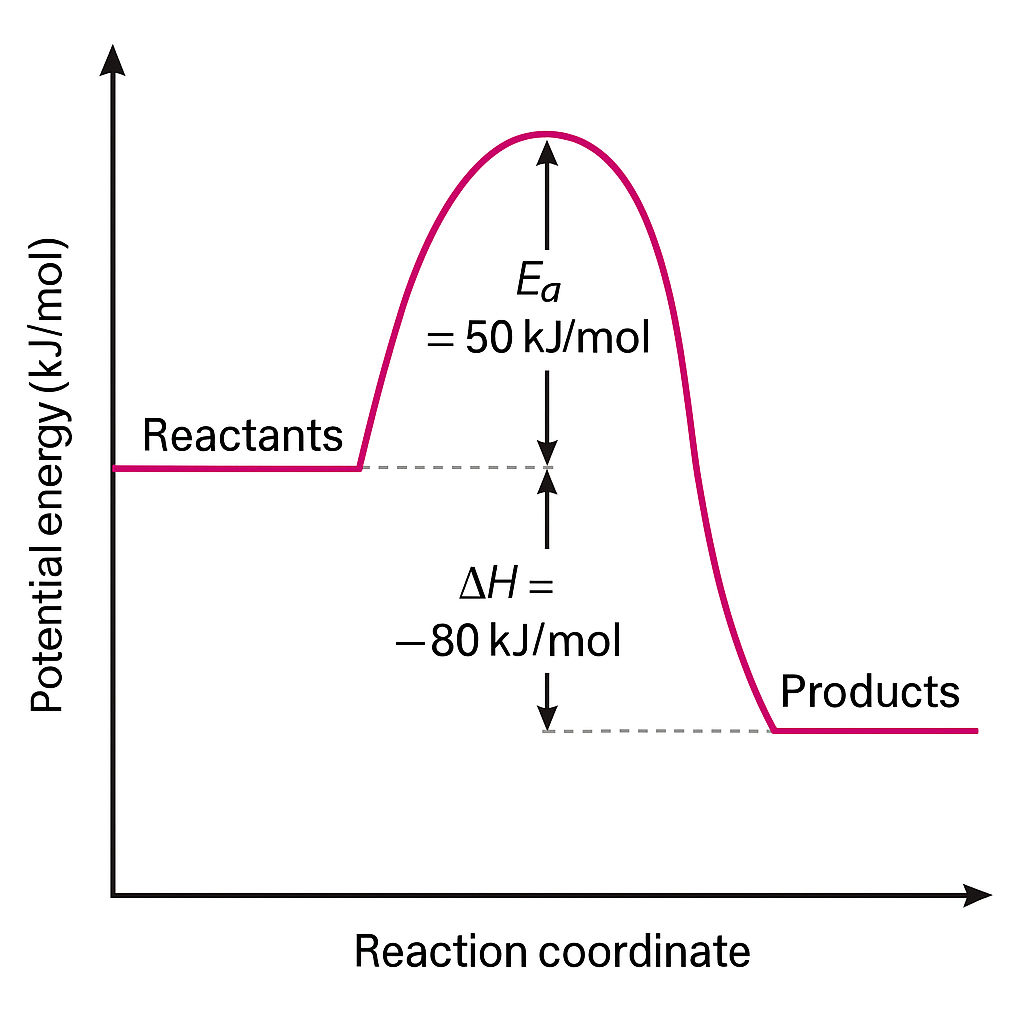
A chemical reaction has the following enthalpy values:
- Energy of reactants = 200 kJ/mol
- Energy of products = 120 kJ/mol
- Activation energy = 50 kJ/mol
Sketch the energy profile diagram and determine if the reaction is endothermic or exothermic.
▶️Answer/Explanation
- ΔH = 120 − 200 = −80 kJ/mol
- Because ΔH is negative, the reaction is exothermic.
- The activation energy (Eₐ) is 50 kJ/mol, so the energy rises to 250 kJ/mol before dropping to 120 kJ/mol.
- The curve would show a peak at 250 kJ/mol (transition state) and a downward slope to the product energy level.

Example
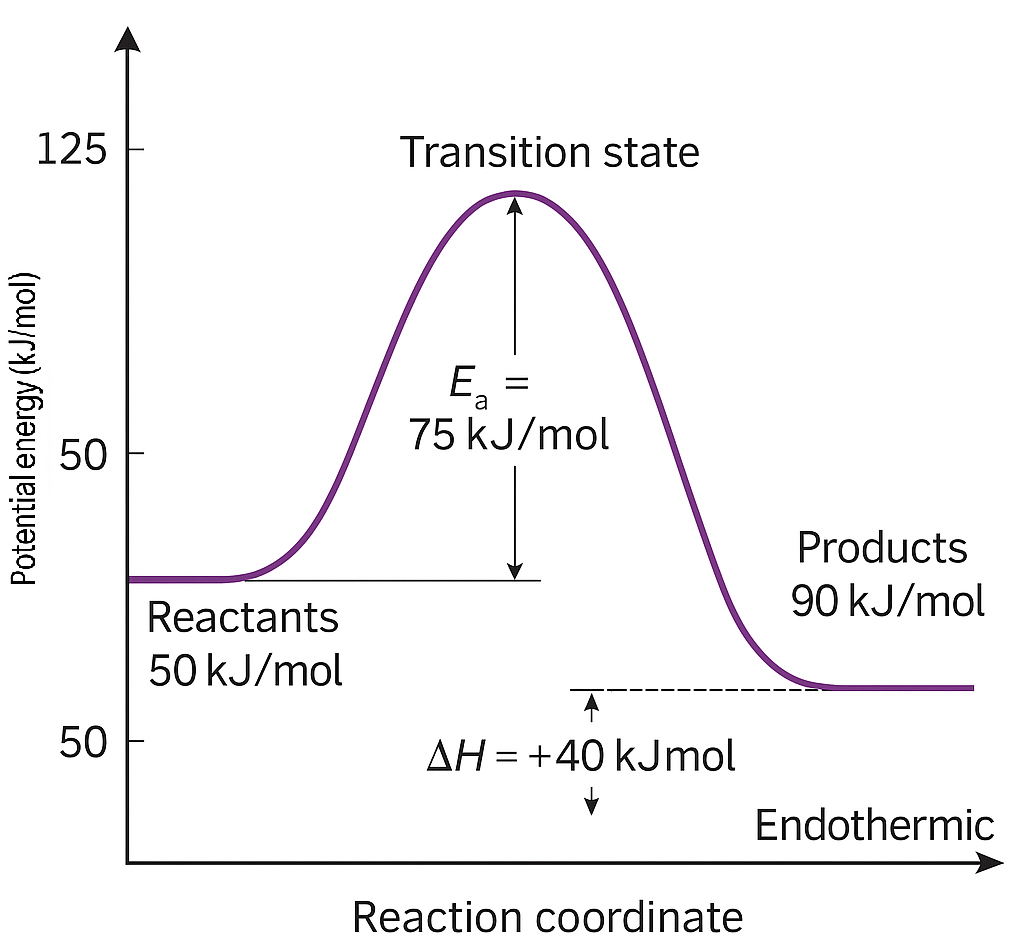
A reaction has an activation energy of 75 kJ/mol and an overall enthalpy change (ΔH) of +40 kJ/mol.
Sketch the energy profile for this reaction, and calculate the potential energy of the products if the reactants begin at 50 kJ/mol on the energy scale.
▶️Answer/Explanation
- The reaction is endothermic since ΔH is positive.
- Potential energy of reactants: 50 kJ/mol (given)
Enthalpy change: ΔH = +40 kJ/mol
So, energy of products = 50 + 40 = 90 kJ/mol - Activation energy (Eₐ) is 75 kJ/mol from the reactants.
So, transition state energy = 50 + 75 = 125 kJ/mol - A complete energy profile diagram should show:
- Reactants at 50 kJ/mol
- Peak (transition state) at 125 kJ/mol
- Products at 90 kJ/mol
- The curve rises from 50 to 125, then drops to 90 — characteristic of an endothermic reaction.