Reactivity 2.2.10 – Reaction Order
The order of a reaction refers to how the rate of a chemical reaction depends on the concentration of one or more reactants.
- The order with respect to a particular reactant is the power (exponent) to which the concentration of that reactant is raised in the rate equation.
- The overall order of the reaction is the sum of the individual orders with respect to each reactant.
General Rate Equation:
\( \text{Rate} = k[A]^m[B]^n \)
- \( k \) = rate constant (depends on temperature and catalyst)
- \( [A], [B] \) = concentrations of reactants A and B
- \( m \), \( n \) = orders of the reaction with respect to A and B respectively
- Overall order = \( m + n \)
How to Determine Reaction Order:
- It must be determined experimentally—it cannot be deduced from the balanced chemical equation (except in elementary steps).
- The order of a reactant gives insight into how many particles of that reactant are involved in the rate-determining step of the reaction mechanism.
Types of Orders:
| Order | Description | Effect on Rate |
|---|---|---|
| Zero Order | Rate is independent of concentration | Rate remains constant even if [A] changes |
| First Order | Rate is directly proportional to concentration | If [A] doubles, rate doubles |
| Second Order | Rate is proportional to the square of concentration | If [A] doubles, rate increases by a factor of 4 |
Importance in Mechanism:
- The order helps determine how many molecules of a substance are involved in the slowest (rate-determining) step.
- It is a vital link between experimental kinetics and reaction mechanisms.
Key Differences from Stoichiometry:
- Reaction orders are found from experimental data, not chemical equations.
- They are not always whole numbers — though for IB Chemistry, only integers (0, 1, 2) are assessed.
Example Rate Equation and Interpretation:
\( \text{Rate} = k[\text{NO}_2]^1[\text{O}_3]^0 \)
- Order with respect to \( \text{NO}_2 \) = 1 (affects rate)
- Order with respect to \( \text{O}_3 \) = 0 (no effect on rate)
- Overall order = 1
Graphical Representations of Reaction Order
Graphical methods are useful for determining the order of a reaction from experimental data. There are two common types of graphs used:
- Concentration–Time Graphs (to monitor how concentration changes over time)
- Rate–Concentration Graphs (to relate reaction rate to reactant concentration)
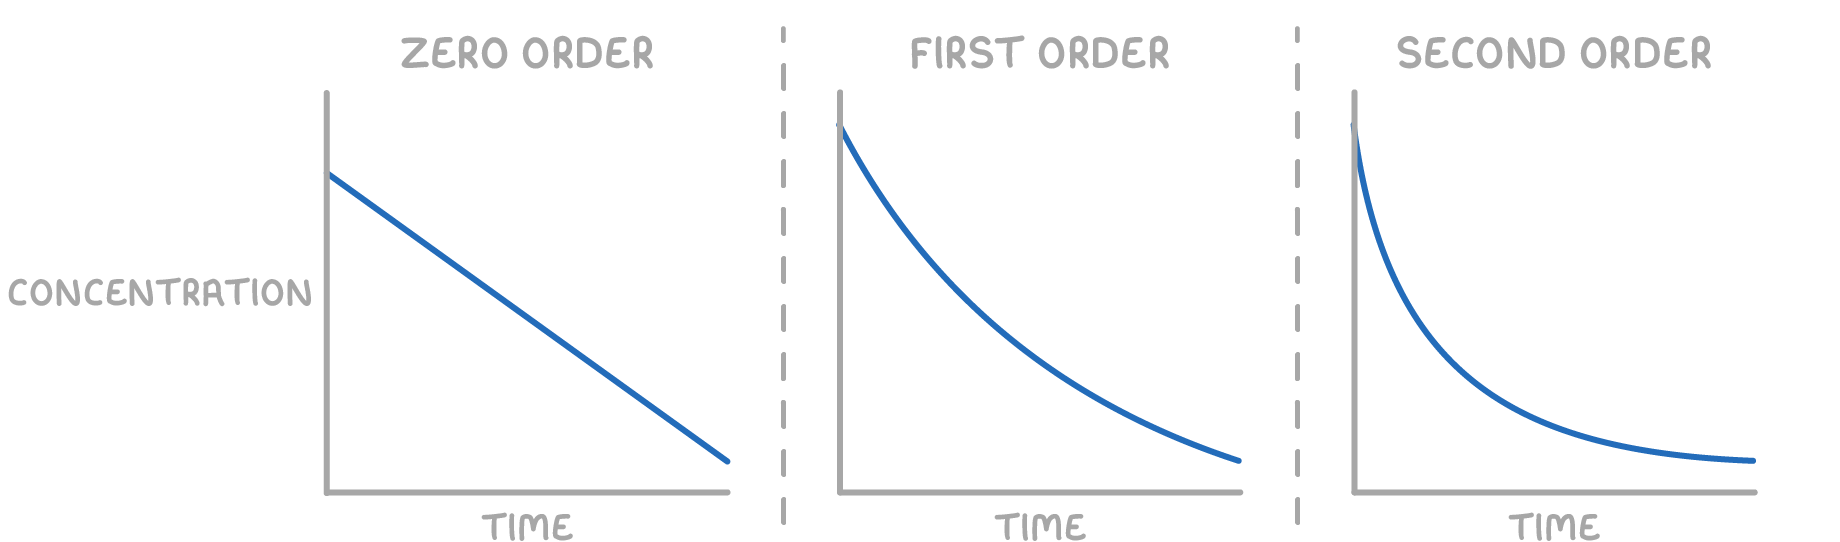
1. Concentration–Time Graphs
| Order | Shape of [A] vs Time Graph | Interpretation |
|---|---|---|
| Zero | Straight line with constant negative slope | Rate is independent of [A] |
| First | Exponential decay | Rate is directly proportional to [A] |
| Second | Steeper exponential decay | Rate is proportional to [A]2 |
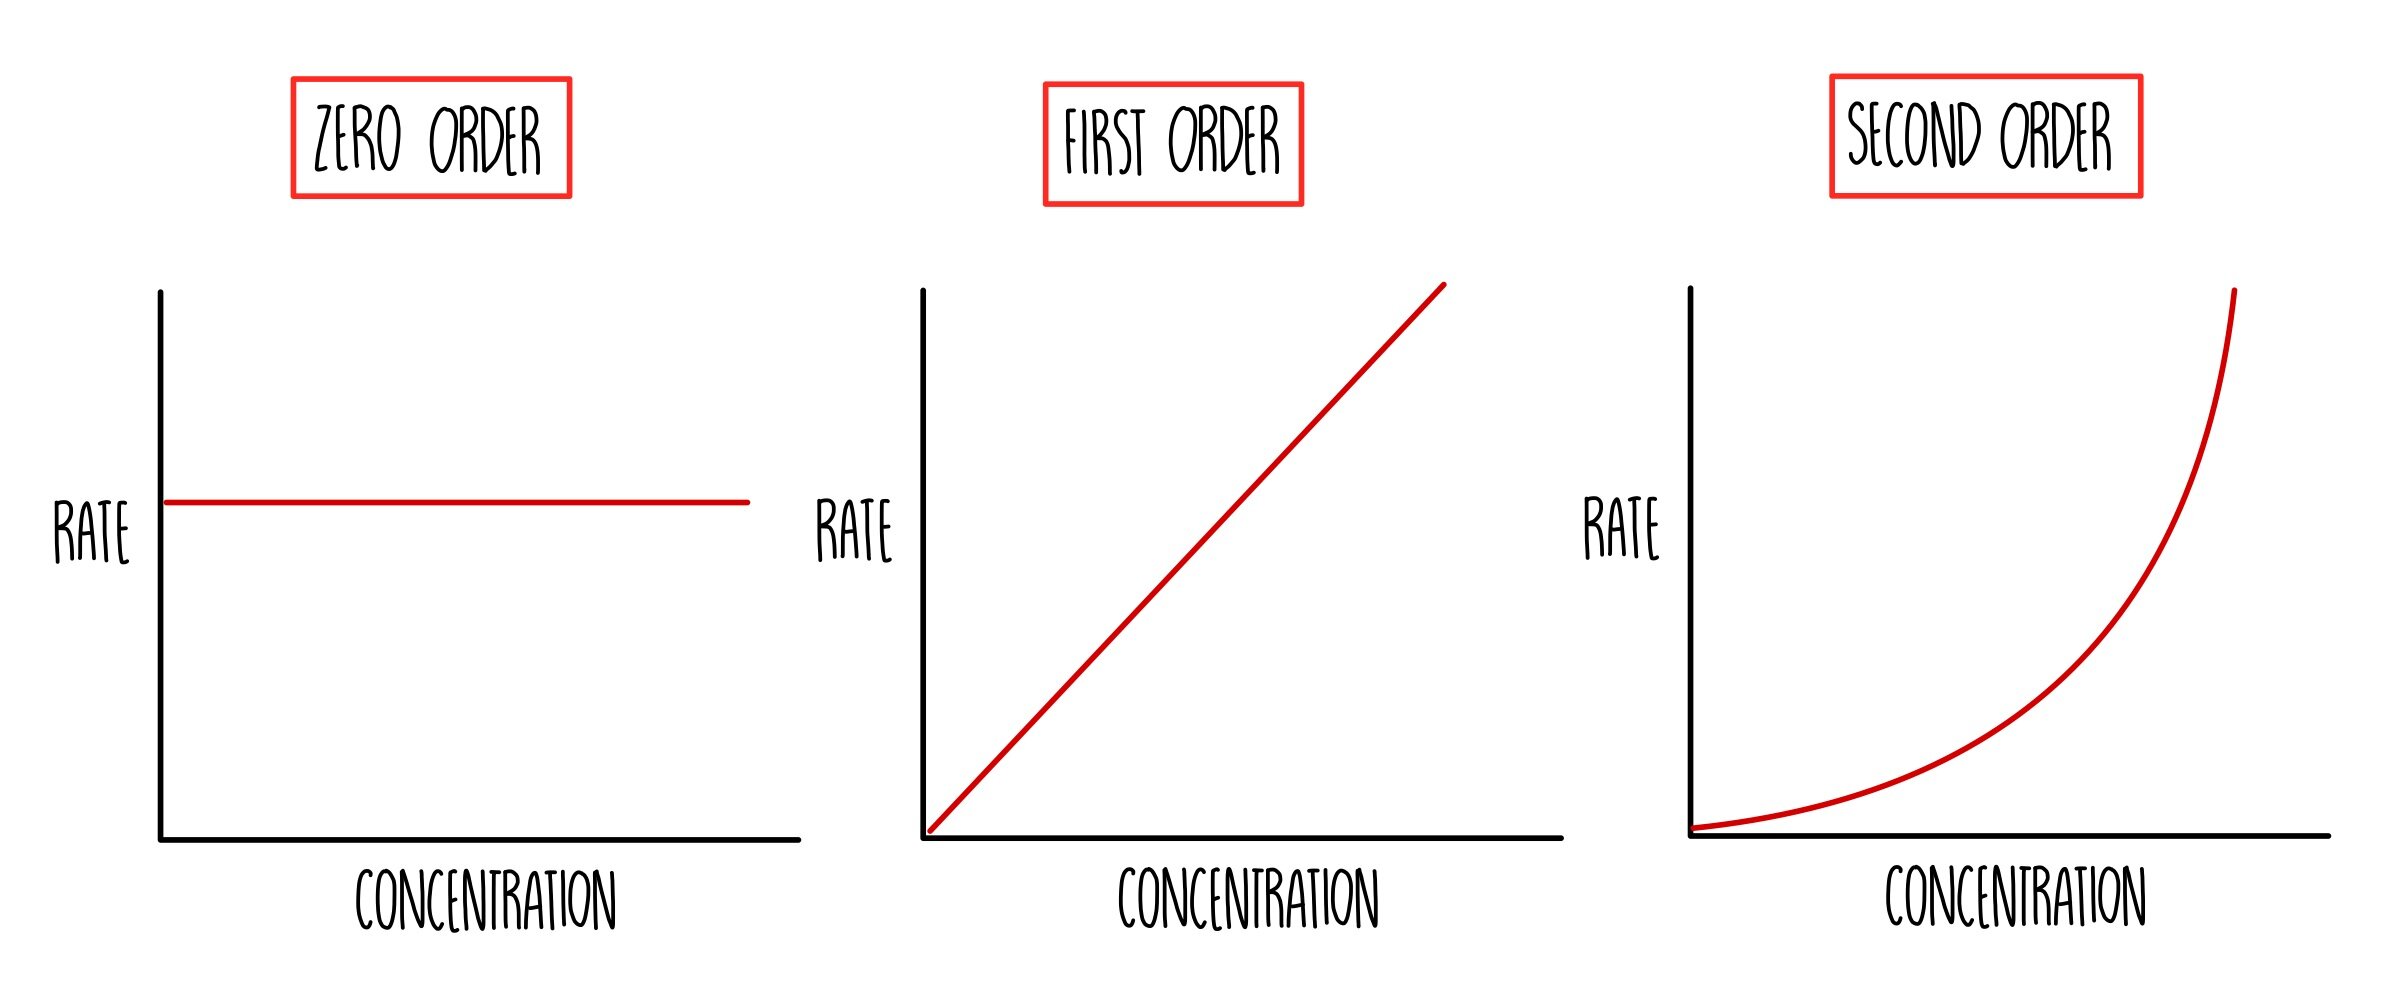
2. Rate–Concentration Graphs
| Order | Shape of Rate vs [A] Graph | Interpretation |
|---|---|---|
| Zero | Horizontal straight line | Rate is constant regardless of [A] |
| First | Straight line through origin | Rate ∝ [A] |
| Second | Upward-sloping curve (quadratic) | Rate ∝ [A]2 |
How to Use the Graphs to Determine Order:
- Plot [A] vs time → observe whether it’s linear or curved.
- Plot rate vs [A] → shape of the curve tells the order directly.
- If you suspect first order: plot ln[A] vs time. If linear, it’s first order.
- If you suspect second order: plot 1/[A] vs time. If linear, it’s second order.
Graph Interpretation Tips:
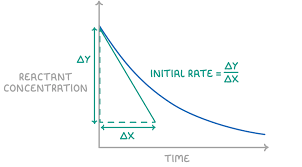
- Always measure rate from slope (gradient) of concentration–time graphs.
- Use tangents on curved graphs for instantaneous rate at a specific time.
- Data tables should be used alongside the graphs to calculate average rates or verify linearity.
Example:
Experimental data for a reaction is collected, and a graph of rate vs [A] is plotted. The plot is a curve that passes through the origin and becomes steeper as [A] increases.
▶️Answer/Explanation
The rate increases non-linearly with concentration, forming a curved plot that suggests a second-order relationship. Therefore, the reaction is second order with respect to A.
Note: For IB assessments, only integer values for reaction orders (0, 1, 2) will be considered. Non-integer orders or complex mechanisms are outside the syllabus.
Example:
A student collects the following data for a reaction between reactants P and Q:
| [P] (mol/L) | [Q] (mol/L) | Initial Rate (mol/L·s) |
|---|---|---|
| 0.10 | 0.10 | 0.020 |
| 0.20 | 0.10 | 0.040 |
| 0.10 | 0.20 | 0.080 |
Determine the order with respect to each reactant and write the rate equation.
▶️Answer/Explanation
Compare experiments 1 and 2: [P] doubles, [Q] constant → rate doubles → first order with respect to P
Compare experiments 1 and 3: [Q] doubles, [P] constant → rate quadruples → second order with respect to Q
Rate law: Rate = 𝑘 [ P ] 1 [ Q ] 2
Rate=k[P] 1 [Q] 2
Overall order = 1 + 2 = 3
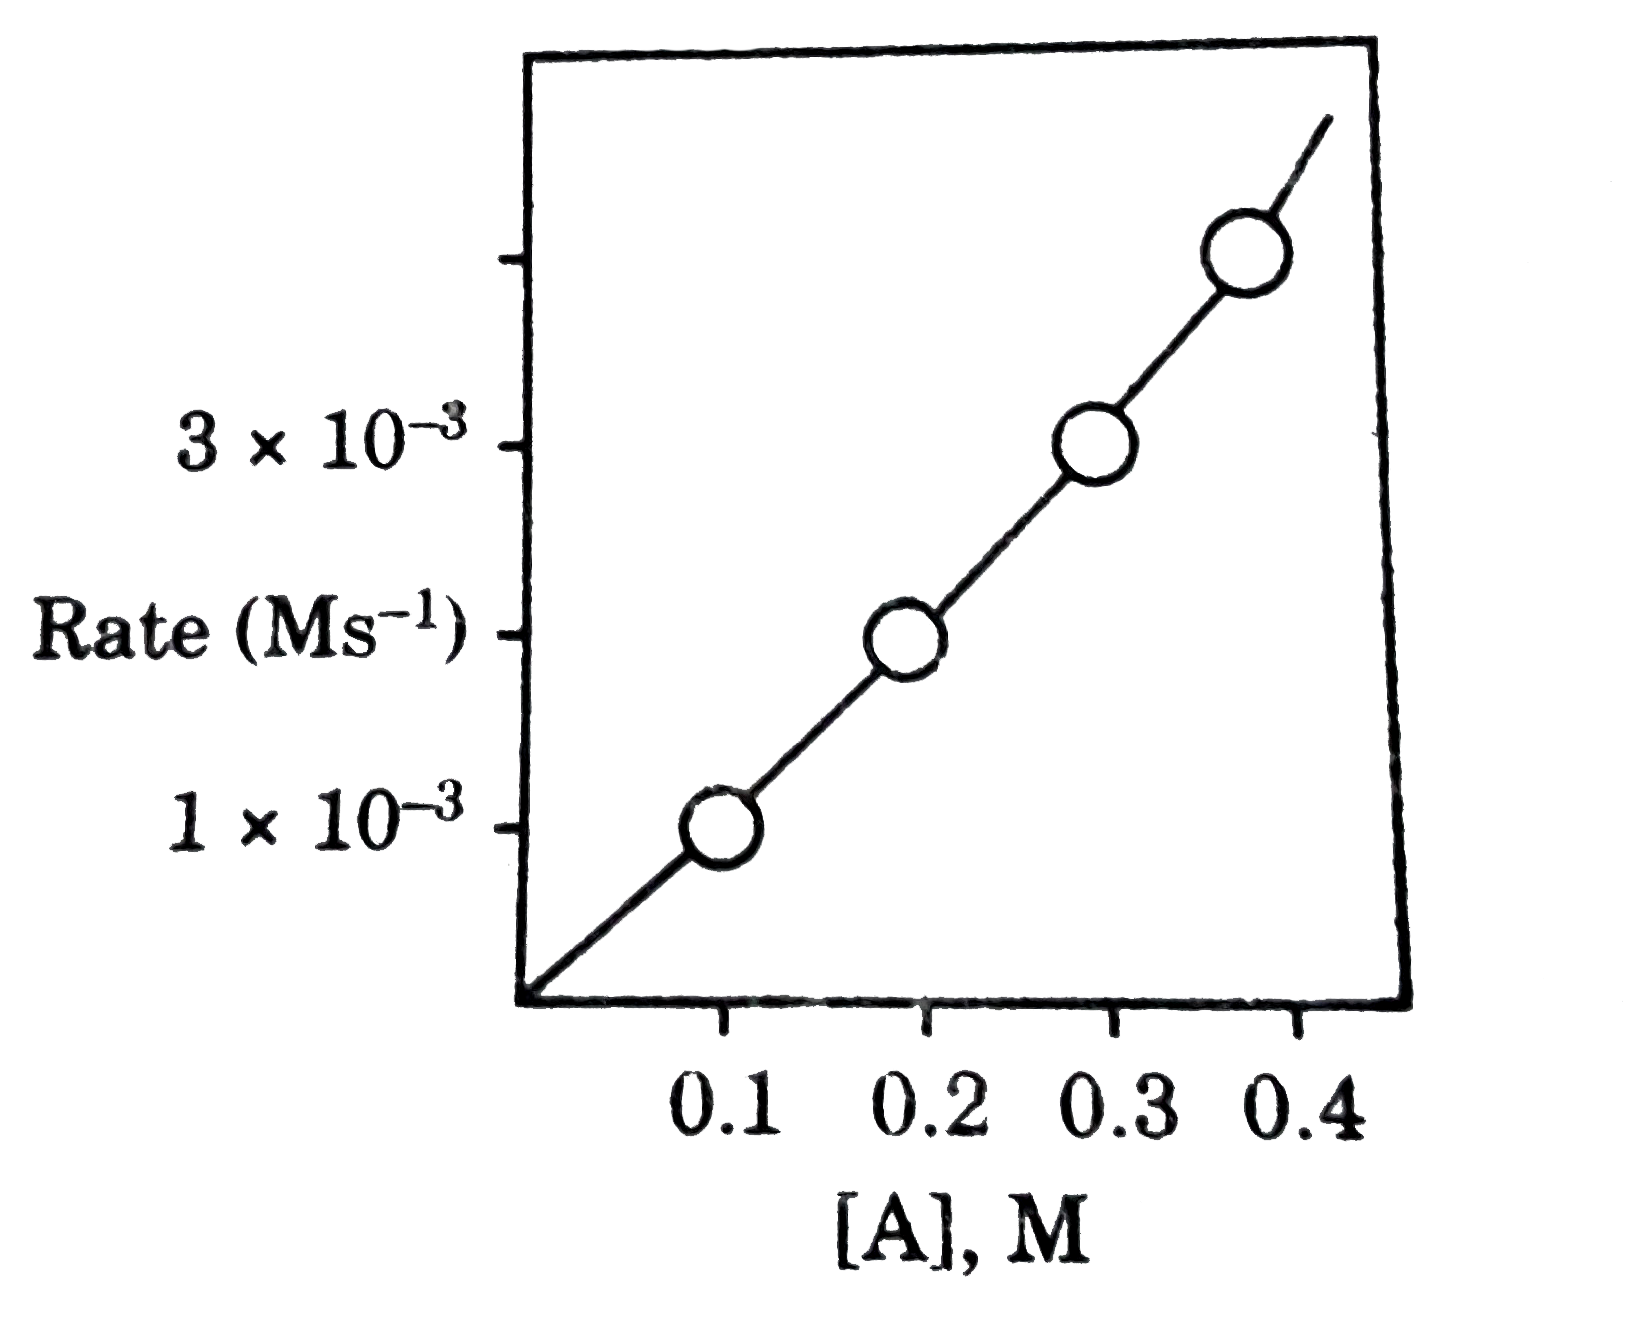
Example :
A student collected the following data for a reaction involving reactant A:
| [A] (mol/L) | Rate (mol·L−1·s−1) |
|---|---|
| 0.1 | \( 1 \times 10^{-3} \) |
| 0.2 | \( 2 \times 10^{-3} \) |
| 0.3 | \( 3 \times 10^{-3} \) |
| 0.4 | \( 4 \times 10^{-3} \) |
Determine the rate law for this reaction based on the given data.
▶️Answer/Explanation
We observe a direct linear relationship between the concentration of A and the rate of reaction.
- When [A] doubles, the rate also doubles.
- This indicates that the reaction is first order with respect to A.
Therefore, the rate law is:
\( \text{Rate} = k[A]^1 \)
Where:
- \( k \) is the rate constant
- \( [A] \) is the concentration of reactant A