Reactivity 2.2.12 – The Arrhenius Equation
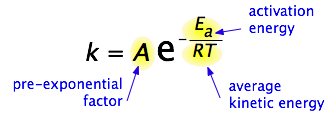
The Arrhenius equation describes how the rate constant \( k \) of a chemical reaction varies with temperature and activation energy:
\( k = A e^{-\frac{E_a}{RT}} \)
- \( k \): Rate constant — determines how fast the reaction occurs
- \( A \): Frequency factor — represents the frequency of collisions with proper orientation (also called the pre-exponential factor)
- \( E_a \): Activation energy (J/mol) — minimum energy required for a reaction to occur
- \( R \): Universal gas constant = 8.314 J mol−1 K−1
- \( T \): Temperature in Kelvin (K)

Qualitative Relationship Between Temperature and the Rate Constant
The Arrhenius equation reveals a clear qualitative relationship:
- As temperature increases, the value of \( \frac{E_a}{RT} \) decreases.
- This makes the exponential term \( e^{-\frac{E_a}{RT}} \) larger (less negative exponent), so the rate constant \( k \) increases.
- Hence, higher temperature results in a larger rate constant and faster reaction.
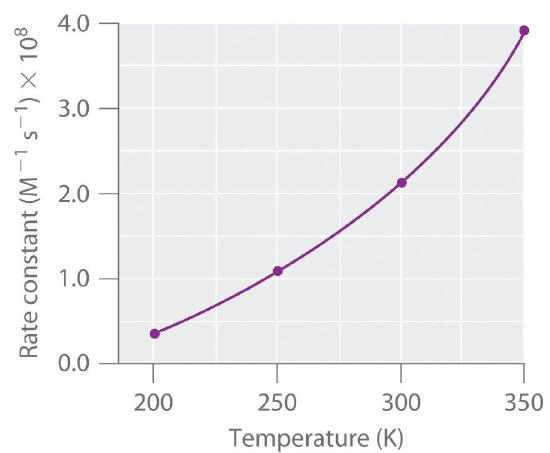
This relationship is not linear, but exponential—small increases in temperature can cause large increases in the rate constant, especially when \( E_a \) is high.
Linear Form of the Arrhenius Equation
For graphical analysis, the equation is rearranged into linear form:
\( \ln k = \ln A – \frac{E_a}{R} \cdot \frac{1}{T} \)
This corresponds to the straight-line form \( y = mx + c \), where:
| Variable | Expression | Interpretation |
|---|---|---|
| \( y \) | \( \ln k \) | Natural log of rate constant |
| \( x \) | \( \frac{1}{T} \) | Inverse of temperature (K−1) |
| Slope | \( -\frac{E_a}{R} \) | Used to calculate activation energy \( E_a \) |
| Intercept | \( \ln A \) | Log of frequency factor |
Graph:
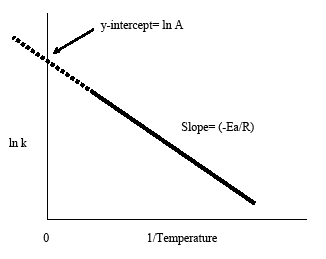
- A plot of \( \ln k \) versus \( \frac{1}{T} \) should yield a straight line. The slope gives information about \( E_a \), and the y-intercept gives \( \ln A \).
- A steeper slope (more negative) on a \( \ln k \) vs. \( \frac{1}{T} \) plot implies a larger activation energy.
Interpretation of the Equation
- Low activation energy → larger \( k \) → faster reaction
- High activation energy → smaller \( k \) → slower reaction
- High temperature → larger \( k \) → faster reaction
The exponential dependence makes temperature a highly sensitive factor in determining reaction speed.
How to Use the Arrhenius Plot
- Obtain experimental values of \( k \) at various temperatures (in Kelvin).
- Calculate \( \ln k \) and \( \frac{1}{T} \) for each data point.
- Plot \( \ln k \) against \( \frac{1}{T} \).
- Determine the slope of the best-fit line. Multiply by \( -R \) to calculate \( E_a \).
Example
Two experiments are performed to determine the rate constants of a reaction at 300 K and 320 K, yielding:
- \( k_1 = 2.5 \times 10^{-4} \, \text{mol}^{-1} \text{dm}^3 \text{s}^{-1} \)
- \( k_2 = 1.5 \times 10^{-3} \, \text{mol}^{-1} \text{dm}^3 \text{s}^{-1} \)
Using this data, calculate the activation energy \( E_a \).
▶️Answer/Explanation
Use the two-point form of the Arrhenius equation: \[ \ln\left(\frac{k_2}{k_1}\right) = \frac{-E_a}{R} \left( \frac{1}{T_2} – \frac{1}{T_1} \right) \] \[ \ln\left(\frac{1.5 \times 10^{-3}}{2.5 \times 10^{-4}}\right) = \frac{-E_a}{8.314} \left( \frac{1}{320} – \frac{1}{300} \right) \] \[ \ln(6) = \frac{-E_a}{8.314} \times (-0.000208) \] \[ 1.7918 = \frac{E_a}{8.314} \times 0.000208 \] \[ E_a = \frac{1.7918}{0.000208} \times 8.314 \approx 71,600 \, \text{J/mol} = 71.6 \, \text{kJ/mol} \]
Example
Experimental data gives the following rate constants at different temperatures:
| T (K) | k (s−1) |
|---|---|
| 298 | 1.60 × 10⁻⁴ |
| 310 | 2.75 × 10⁻⁴ |
| 322 | 4.20 × 10⁻⁴ |
▶️Answer/Explanation
Step 1: Convert values to \( \ln k \) and \( \frac{1}{T} \)
- \( \ln(1.60 \times 10^{-4}) = -8.74 \), \( \frac{1}{298} = 0.00336 \)
- \( \ln(2.75 \times 10^{-4}) = -8.20 \), \( \frac{1}{310} = 0.00323 \)
- \( \ln(4.20 \times 10^{-4}) = -7.77 \), \( \frac{1}{322} = 0.00311 \)
Step 2: Plot \( \ln k \) vs. \( \frac{1}{T} \) and find slope of the line: slope ≈ −5100
Step 3: Calculate activation energy:
\[ \text{slope} = -\frac{E_a}{R} \Rightarrow E_a = -\text{slope} \times R = 5100 \times 8.314 = 42,401 \, \text{J/mol} = 42.4 \, \text{kJ/mol} \]
Example
The table below shows the rate constants for a first-order rearrangement reaction at various temperatures.
Calculate the activation energy for the reaction:
- (a) by plotting a graph of \( \ln k \) vs \( \frac{1}{T} \)
- (b) by using the Arrhenius equation algebraically
| T (K) | k (s⁻¹) |
|---|---|
| 1400 | 0.022 |
| 1460 | 0.07 |
| 1520 | 0.21 |
| 1580 | 0.686 |
| 1620 | 1.578 |
▶️Answer/Explanation
(a) Graphical Method
We use the linear form of the Arrhenius equation:
\( \ln k = \ln A – \frac{E_a}{R} \cdot \frac{1}{T} \)
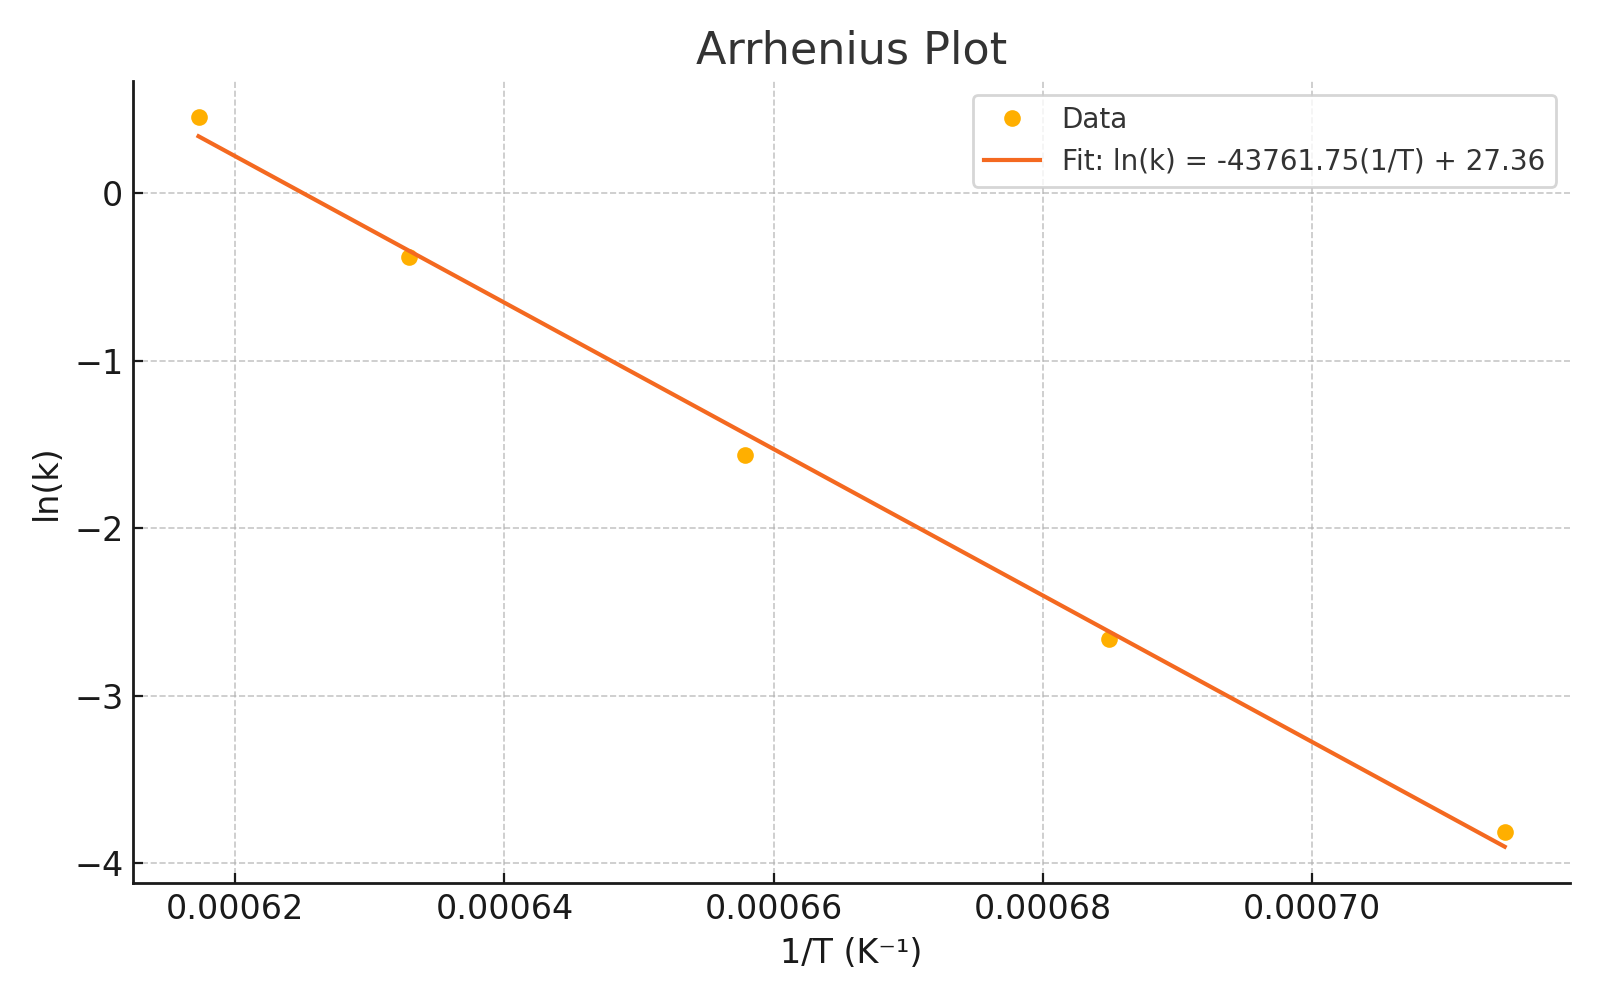
By plotting \( \ln k \) vs \( \frac{1}{T} \), the slope of the line is \( -\frac{E_a}{R} \).
Result from graph:
\( \text{slope} = -43754.6 \) → \( E_a = -\text{slope} \cdot R = 43754.6 \cdot 8.314 = \textbf{363835 J/mol} = 363.8 \ \text{kJ/mol} \)
(b) Algebraic Method
Using the two-point form of the Arrhenius equation:
\[ \ln\left(\frac{k_2}{k_1}\right) = \frac{-E_a}{R} \left(\frac{1}{T_2} – \frac{1}{T_1}\right) \] Rearranged to solve for \( E_a \):
\[ E_a = \frac{\ln(k_2 / k_1)}{(1/T_2 – 1/T_1)} \times R \] Where:
\( R = 8.314 \ \text{J/mol·K} \)
\( T_1 = 1400 \ \text{K}, \ T_2 = 1620 \ \text{K} \)
\( k_1 = 0.022, \ k_2 = 1.578 \)
Step 1: Calculate \( \ln(k_2 / k_1) \):
\( \ln(1.578 / 0.022) \approx 4.682 \)
Step 2: Calculate \( \frac{1}{T_2} – \frac{1}{T_1} \):
\( \frac{1}{1620} – \frac{1}{1400} \approx -8.418 \times 10^{-5} \ \text{K}^{-1} \)
Step 3: Plug into the equation:
\[ E_a = \frac{4.682}{-8.418 \times 10^{-5}} \times 8.314 \approx 366230 \ \text{J/mol} = \boxed{366.23 \ \text{kJ/mol}} \]
Final Answers:
- From graph: \( E_a \approx 363.8 \ \text{kJ/mol} \)
- From two-point calculation: \( E_a \approx 366.23\ \text{kJ/mol} \)