Reactivity 2.2.4 – Activation Energy
Activation Energy:
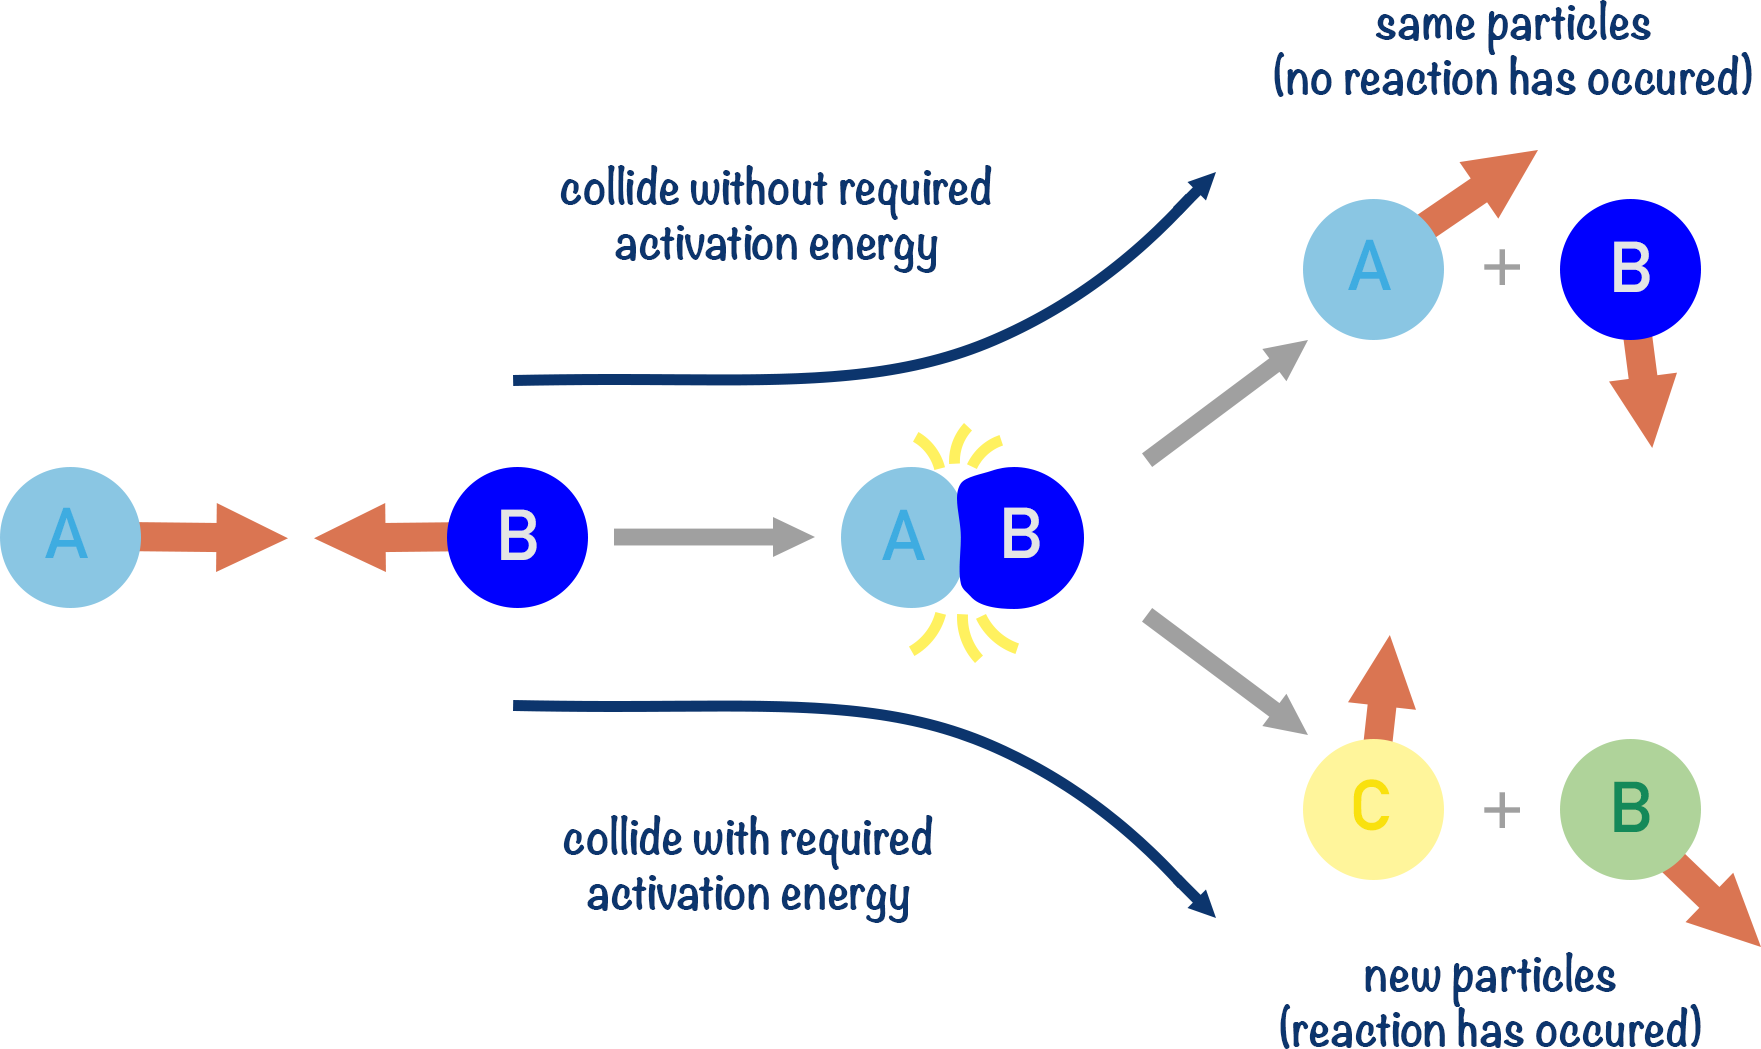
Activation energy (symbol: \( E_a \)) is the minimum amount of energy that colliding particles must possess for a chemical reaction to occur.
Only particles with kinetic energy equal to or greater than \( E_a \) can undergo successful collisions that result in the formation of products.
Key Features of Activation Energy:
- Reactions involve breaking bonds in reactants and forming new bonds in products.
- To break existing bonds, a certain minimum energy—called the activation energy—is needed.
- Activation energy acts as an energy barrier that must be overcome for the reaction to proceed.
- Particles that collide with less energy than \( E_a \) do not result in a chemical change.
Kinetic Theory and Collision Theory Perspective:
- In a gas or solution, particles move randomly with varying kinetic energies.
- Most collisions are ineffective because the particles do not have enough energy.
- Only a fraction of collisions have energy ≥ \( E_a \), leading to a reaction.
- These are called effective collisions.
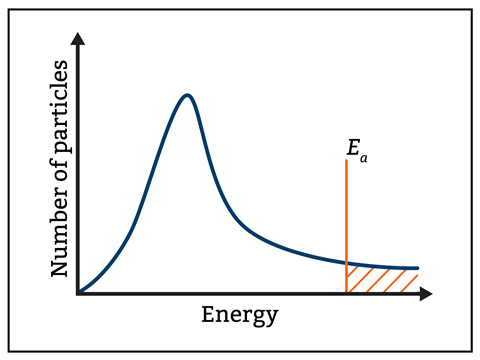
Graphical Representation:
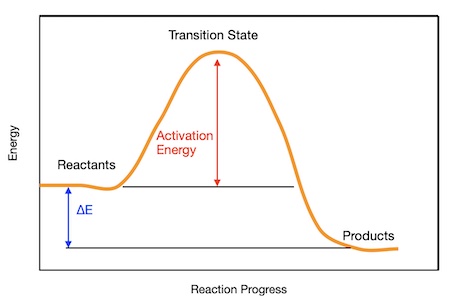
In a reaction profile diagram, activation energy is represented by the energy difference between the reactants and the transition state (or activated complex).
Energy Profile Diagram:
- Y-axis: Potential energy
- X-axis: Reaction progress
- The peak of the curve is the transition state, and the height from reactants to this peak is \( E_a \).
Important Notes:
- Exothermic reactions still require activation energy.
- Even highly spontaneous reactions (with negative ΔH) may occur slowly if \( E_a \) is high.
- Activation energy can be lowered by using a catalyst, which increases the rate of reaction.
Example:
Burning Methane in Air:
\( \text{CH}_4(g) + 2\text{O}_2(g) \rightarrow \text{CO}_2(g) + 2\text{H}_2\text{O}(g) \)
Methane is flammable, but does not ignite spontaneously at room temperature. Why is a flame or spark necessary to initiate combustion?
▶️Answer/Explanation
This reaction is exothermic and thermodynamically favorable, but it requires a significant activation energy to break the bonds in methane and oxygen. A flame or spark provides enough energy to allow some particles to reach \( E_a \). Once started, the energy released sustains further collisions with enough energy, leading to rapid combustion.
Key Takeaways:
- \( E_a \) determines how many particles can participate in a reaction at a given temperature.
- Reactions with high \( E_a \) are slow, while those with low \( E_a \) are fast.
- Even exothermic reactions need activation energy to start.
- Using a catalyst reduces \( E_a \), increasing the proportion of effective collisions.
Maxwell–Boltzmann Energy Distribution
The Maxwell–Boltzmann distribution is a statistical model that shows the spread of kinetic energies among particles in a gas at a specific temperature. It describes how many particles in a sample have a particular amount of kinetic energy.
Axes of the Maxwell–Boltzmann Curve:
- Y-axis: Kinetic energy of particles
- X-axis: Number (or proportion) of particles with that energy
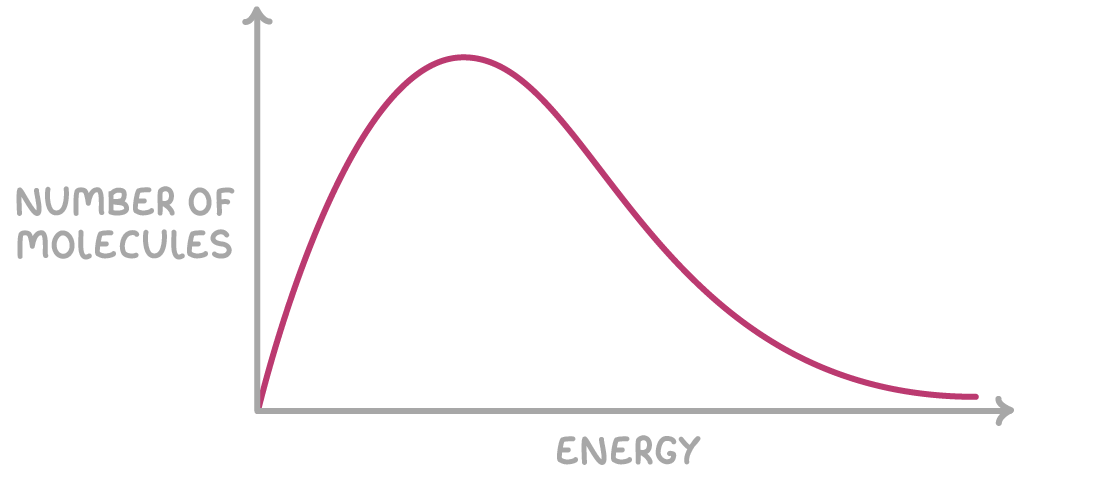
Key Characteristics of the Curve:
- Starts at the origin (no particles have zero kinetic energy).
- Peaks at the most probable energy (where the highest number of particles are found).
- Falls gradually to the right and never touches the x-axis—some particles always have very high energy.
- The area under the curve is constant—it represents the total number of particles in the system.
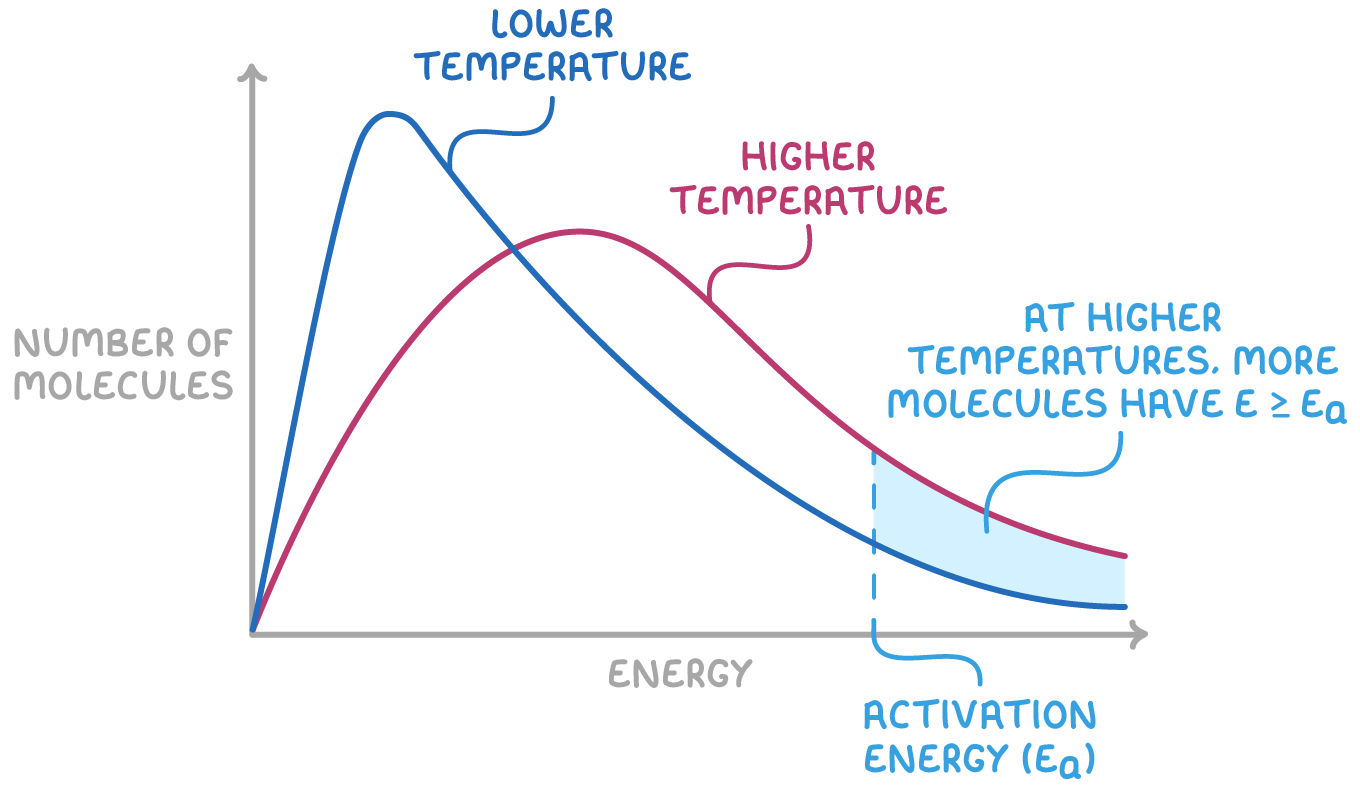
Activation Energy and the Curve:
A vertical line drawn on the curve represents the activation energy \( E_a \). Only the area under the curve to the right of this line represents the particles that have sufficient energy to react (i.e., particles with energy ≥ \( E_a \)).
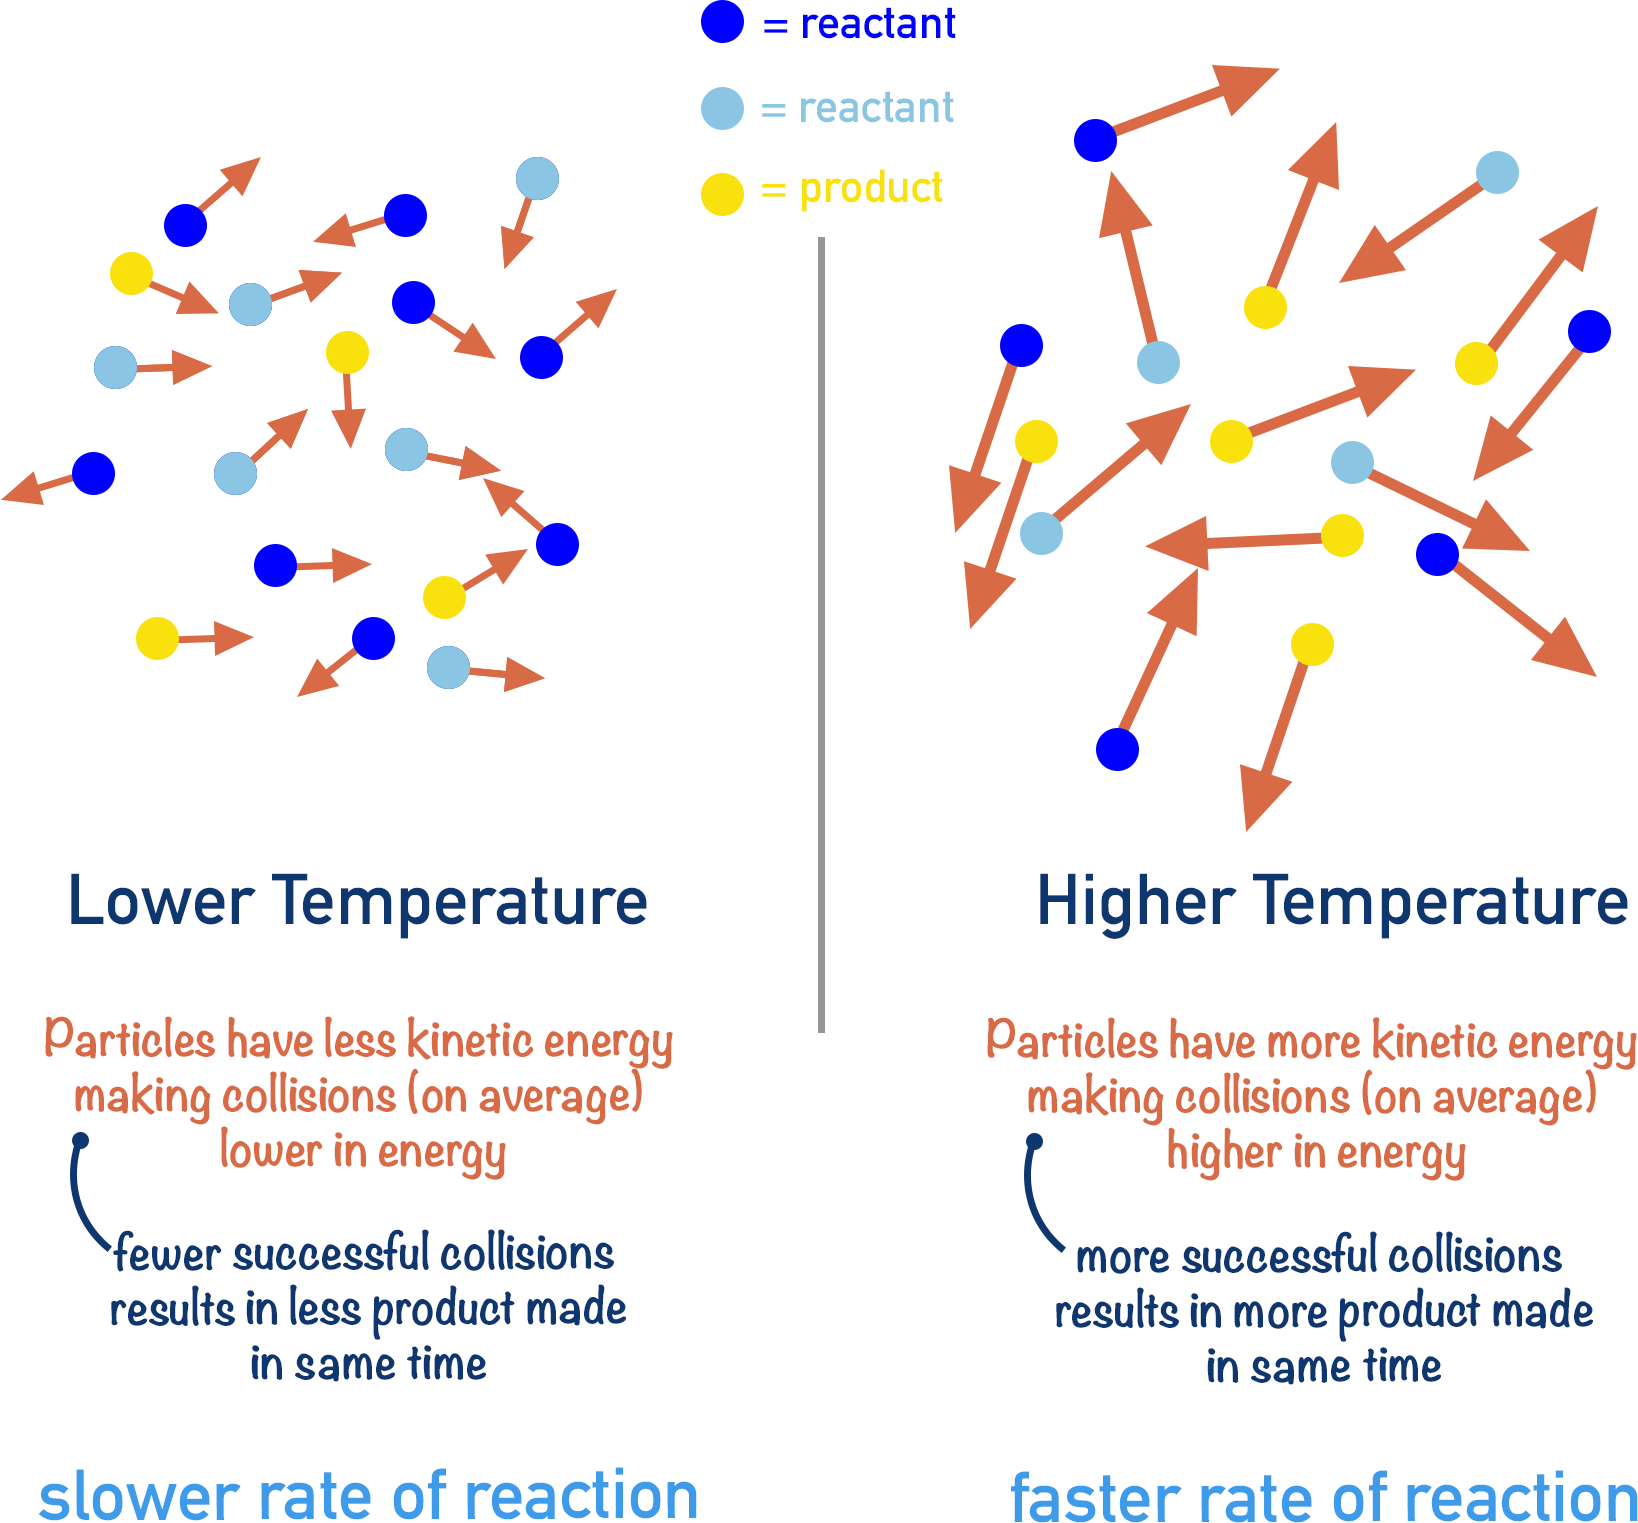
Effect of Increasing Temperature:
- As temperature increases, the curve becomes flatter and wider.
- The peak shifts to the right (toward higher energies).
- More particles have kinetic energy ≥ \( E_a \).
- This results in an increased number of effective collisions, and thus a faster reaction rate.
- The area under the curve remains constant (total particles unchanged).
Effect of Decreasing Temperature:
- The peak becomes sharper and shifts left toward lower energy.
- Fewer particles have enough energy to overcome the activation barrier.
- Reaction rate decreases due to fewer effective collisions.
Example:
Reaction Between Sodium Thiosulfate and Hydrochloric Acid:
\( \text{Na}_2\text{S}_2\text{O}_3(aq) + 2\text{HCl}(aq) \rightarrow 2\text{NaCl}(aq) + \text{SO}_2(g) + \text{S}(s) + \text{H}_2\text{O}(l) \)
When this reaction is performed at higher temperatures, the time taken for the solution to turn cloudy (due to sulfur formation) decreases. Why?
▶️Answer/Explanation
An increase in temperature shifts the Maxwell–Boltzmann distribution curve, increasing the fraction of particles with kinetic energy ≥ \( E_a \). As a result, there are more successful collisions per unit time, and sulfur precipitates faster, making the solution turn cloudy more quickly.
Example:
Catalytic Decomposition of Hydrogen Peroxide:
\( 2\text{H}_2\text{O}_2(aq) \rightarrow 2\text{H}_2\text{O}(l) + \text{O}_2(g) \)
Why does the rate of decomposition increase significantly when manganese(IV) oxide is added?
▶️Answer/Explanation
Manganese(IV) oxide acts as a catalyst by providing an alternative reaction pathway with lower activation energy. This means a much larger fraction of particles (based on the Maxwell–Boltzmann distribution) now have sufficient energy to react. The frequency of successful collisions increases, accelerating the reaction even at room temperature.
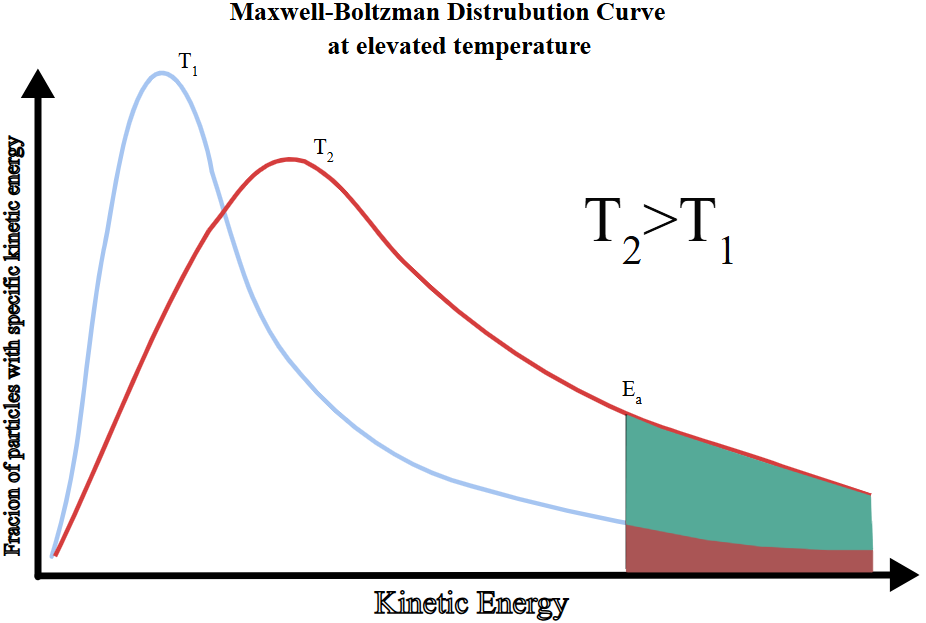
Annotated Maxwell–Boltzmann Diagram Description:
- Two curves on the same axes—one for low temperature (T₁), one for high temperature (T₂ > T₁).
- Both curves start at the origin and have the same total area.
- Curve at T₂ is flatter and shifted right.
- Mark \( E_a \) as a vertical line; highlight the shaded area under each curve to the right of \( E_a \).
Effect of Temperature on Reaction Rate (via Maxwell–Boltzmann Distribution)
| Condition | Distribution Curve Effect | Effect on Reaction Rate |
|---|---|---|
| Increase in temperature | Curve flattens and shifts right; more particles have \( E \geq E_a \) | Higher rate due to more effective collisions |
| Decrease in temperature | Curve becomes narrower and shifts left; fewer particles with \( E \geq E_a \) | Lower rate due to fewer effective collisions |